Fig. 3
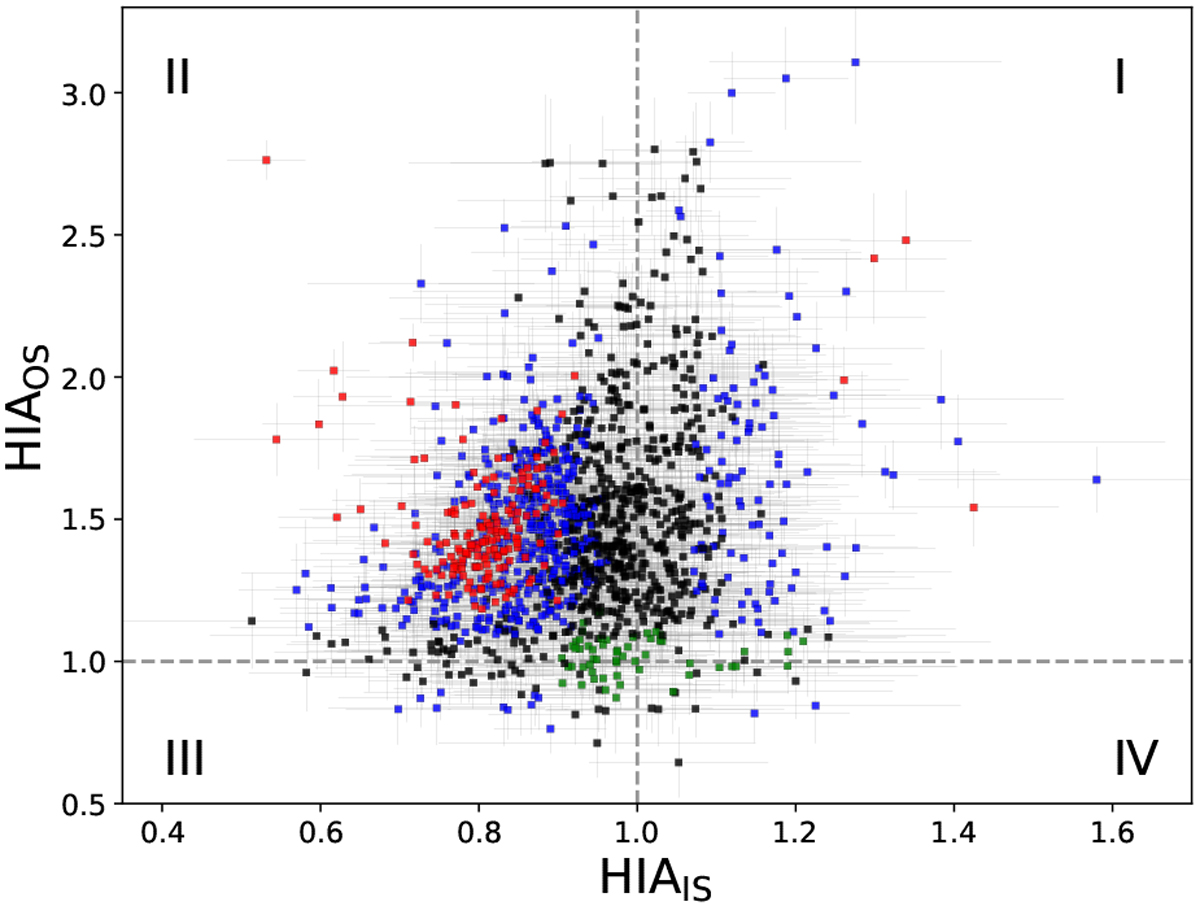
Distribution of the integrated hyperfine intensity anomalies of the inner (HIAIS) and outer (HIAOS) satellite lines. The red (blue) points illustrate positions, where both the HIAIS and HIAOS values deviate by more than 3σ (1σ) from unity. Black points denote positions, where either the HIAIS or the HIAOS is located within 1σ of unity, while the green points show positions, where both the HIAIS and HIAOS are within 1σ of unity. Grey dashed vertical and horizontal lines subdivide the panel into regions with HIAIS >1 (labelled I for HIAOS>1 and IV for HIAOS<1) and HIAIS<1 (labeled II for HIAOS>1 and III for HIAOS<1).
Current usage metrics show cumulative count of Article Views (full-text article views including HTML views, PDF and ePub downloads, according to the available data) and Abstracts Views on Vision4Press platform.
Data correspond to usage on the plateform after 2015. The current usage metrics is available 48-96 hours after online publication and is updated daily on week days.
Initial download of the metrics may take a while.