Free Access
Fig. 2
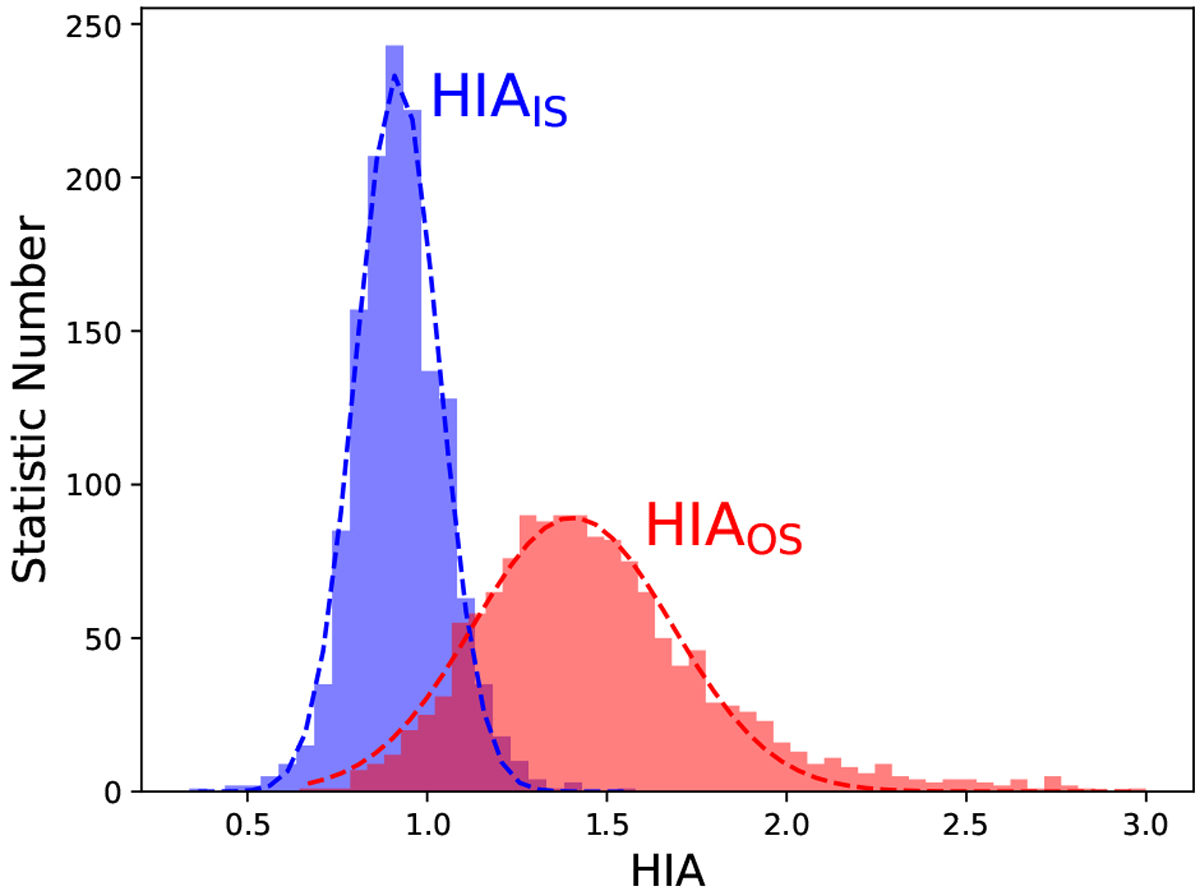
Histograms of the integrated hyperfine intensity anomalies of the inner satellite lines (the blue histogram) and the outer satellite lines (the red histogram) of the spectra with an S/N larger than 15. The dashed blue and red lines represent the fitted results by assuming that they are subject to Gaussian distributions.
Current usage metrics show cumulative count of Article Views (full-text article views including HTML views, PDF and ePub downloads, according to the available data) and Abstracts Views on Vision4Press platform.
Data correspond to usage on the plateform after 2015. The current usage metrics is available 48-96 hours after online publication and is updated daily on week days.
Initial download of the metrics may take a while.