Fig. 1
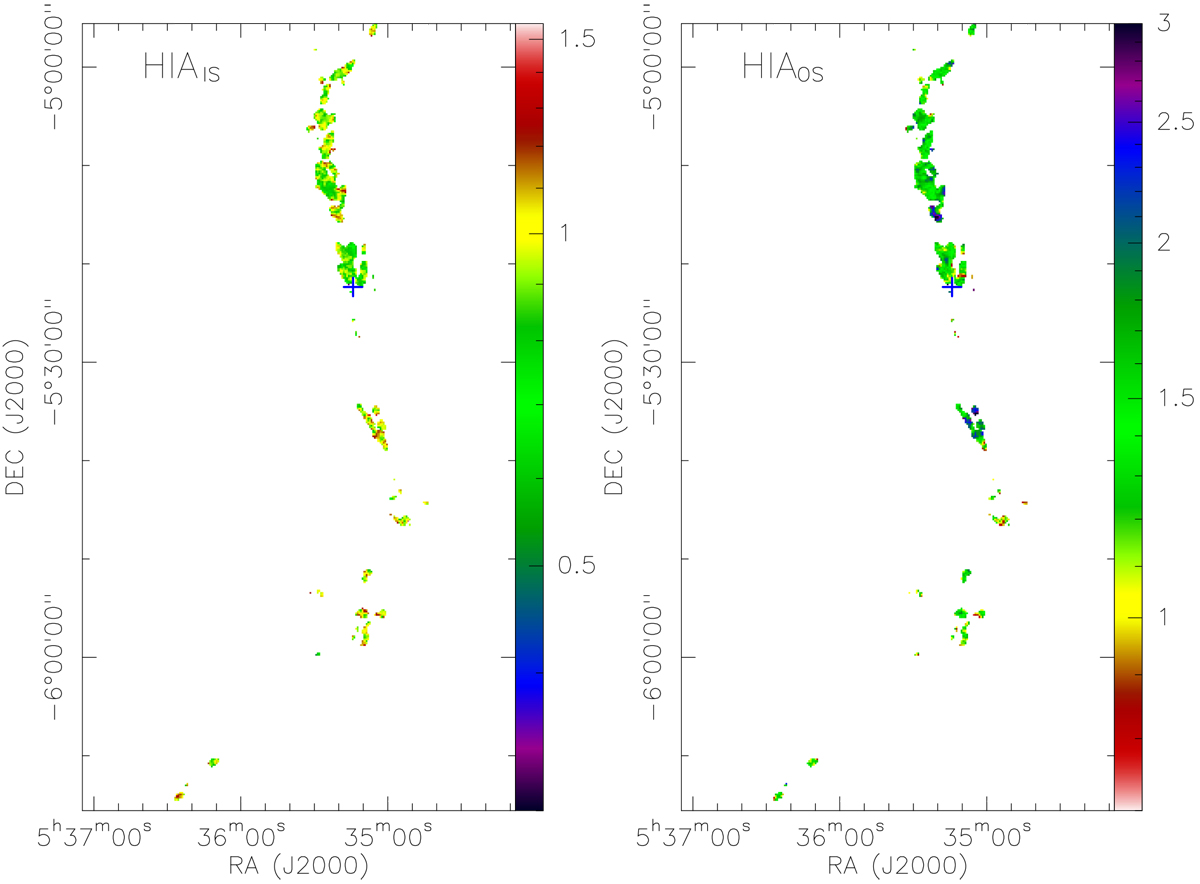
Integrated hyperfine intensity anomalies of the inner satellite lines (left panel) and the outer satellite lines (right panel) derived from 1383 spectra with an S/N larger than 15 in the Integral-Shaped Filament (ISF) of the Orion A molecular cloud. The blue cross in each panel illustrates the location of the Orion Kleinmann-Low Nebula (RA 05:35:14.16 Dec -05:22:21.5 J2000).
Current usage metrics show cumulative count of Article Views (full-text article views including HTML views, PDF and ePub downloads, according to the available data) and Abstracts Views on Vision4Press platform.
Data correspond to usage on the plateform after 2015. The current usage metrics is available 48-96 hours after online publication and is updated daily on week days.
Initial download of the metrics may take a while.