Fig. A.23.
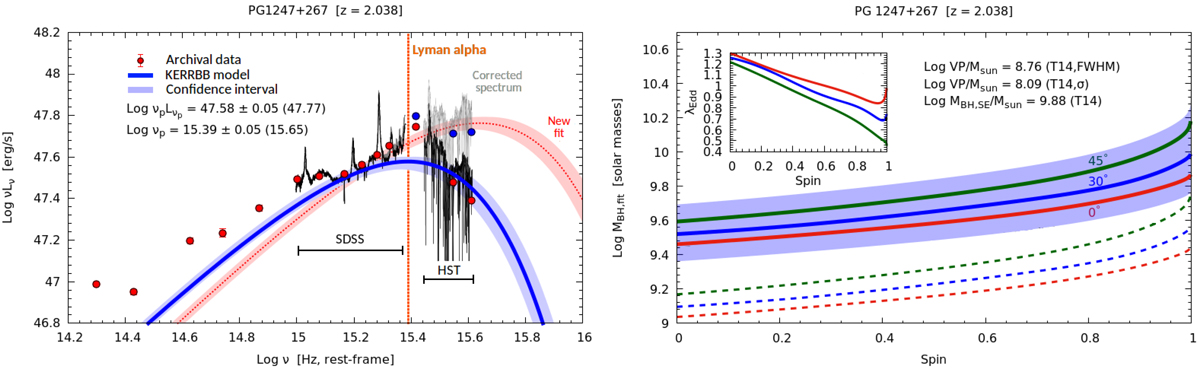
Fit of the source PG 1247+267. For this source, we tried to correct the spectrum emission from IGM absorption at large frequencies by following Madau (1995) and Haardt & Madau (2012). Right panel: thick and dashed lines correspond to the first and second fits, respectively (blue and red lines on the left panel, respectively).
Current usage metrics show cumulative count of Article Views (full-text article views including HTML views, PDF and ePub downloads, according to the available data) and Abstracts Views on Vision4Press platform.
Data correspond to usage on the plateform after 2015. The current usage metrics is available 48-96 hours after online publication and is updated daily on week days.
Initial download of the metrics may take a while.