Fig. 1.
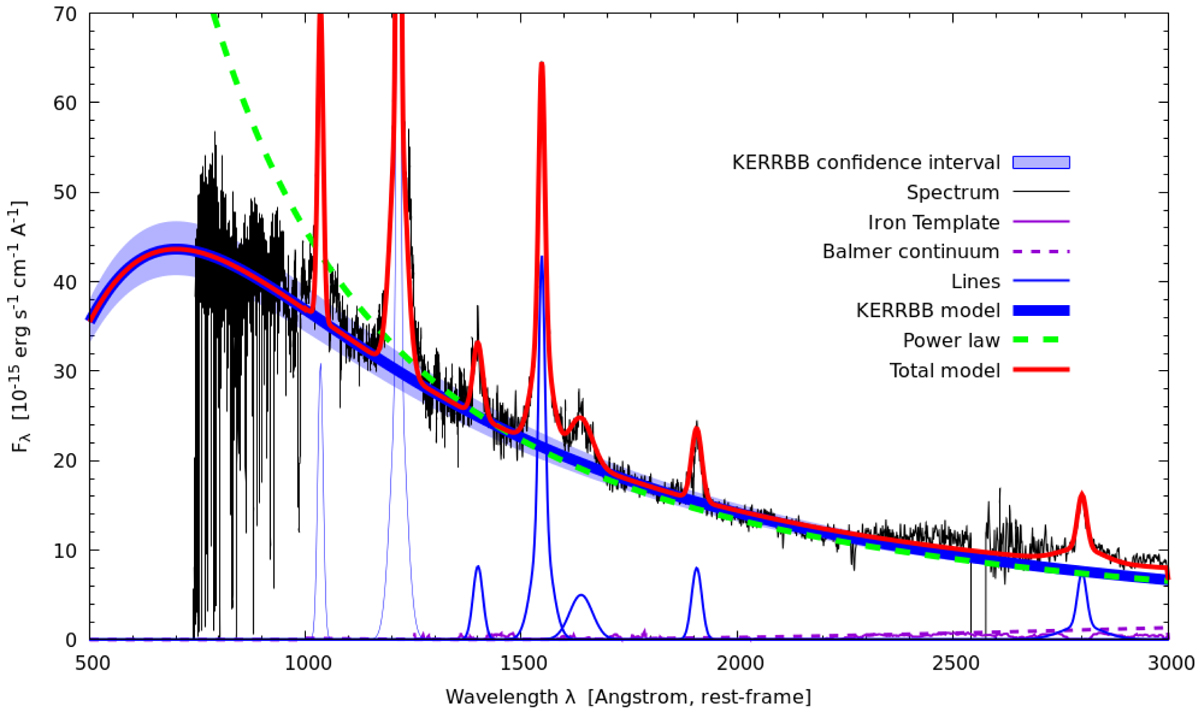
Example of a fit of the composite FUSE – HST – KPNO spectrum of the source PG 0953+414 (from Shang et al. 2005). The modeling performed with KERRBB (thick blue line) describes the AGN continuum, the iron complex (purple line), the Balmer continuum (purple dashed line), and some prominent emission lines (MgII, CIII, CIV, SiIV, Lyα) described by a simple Gaussian profile (blue lines). The red line represents the sum of all these components. The green dashed line is a standard power-law continuum (slope α = −1.77): for λ > 1300 Å, the KERRBB model overlaps the power-law rather well within the average confidence interval (∼0.05 dex, blue shaded area) and is not affected significantly by the presence of lines or other spectral features. Abundant interstellar absorption lines at λ < 1000 Å have a negligible effect on the determination of the spectral peak emission (see Sect. 4).
Current usage metrics show cumulative count of Article Views (full-text article views including HTML views, PDF and ePub downloads, according to the available data) and Abstracts Views on Vision4Press platform.
Data correspond to usage on the plateform after 2015. The current usage metrics is available 48-96 hours after online publication and is updated daily on week days.
Initial download of the metrics may take a while.