| Issue |
A&A
Volume 640, August 2020
|
|
|---|---|---|
| Article Number | A68 | |
| Number of page(s) | 10 | |
| Section | Cosmology (including clusters of galaxies) | |
| DOI | https://doi.org/10.1051/0004-6361/201935971 | |
| Published online | 13 August 2020 | |
Infrared-detected AGNs in the local Universe
1
Kapteyn Astronomical Institute, University of Groningen, PO Box 800, 9700 AV Groningen, The Netherlands
e-mail: This email address is being protected from spambots. You need JavaScript enabled to view it.
2
Department of Astronomy and Astrophysics, Faculty of Science, Atatürk University, Erzurum 25240, Turkey
3
Atatürk University Astrophysics Research and Application Center (ATASAM), Erzurum 25240, Turkey
Received:
28
May
2019
Accepted:
10
June
2020
Abstract
Context. Spitzer/IRAC color selection is a promising technique to identify hot accreting nuclei, that is, active galactic nuclei (AGN), in galaxies. We demonstrate this using a small sample of SAURON galaxies and then explore this technique further.
Aims. The goal of this study is to find a simple and efficient way to reveal optically obscured nuclear accretion in (nearby) galaxies.
Methods. We applied an infrared selection method to the Spitzer Survey of Stellar Structures in Galaxies (S4G) sample of more than 2500 galaxies, together with its extension sample of more than 400 galaxies. We used the Spitzer colors to find galaxies in the S4G survey containing a hot core, suggesting the presence of a strong AGN, and we studied the detection fraction as a function of morphological type. We tested this infrared color selection method by examining the radio properties of the galaxies via the VLA NVSS and FIRST surveys.
Results. Using the radio data, we demonstrate that galaxies displaying hot mid-infrared nuclei stand out as (candidate) active galaxies. We reproduce these results when using colors from the lower spatial resolution WISE mission instead of Spitzer. Hence multiband infrared imaging represents a useful tool to uncover optically obscured nuclear activity in galaxies.
Key words: galaxies: active / galaxies: nuclei / infrared: galaxies / galaxies: photometry
© ESO 2020
1. Introduction
Galaxies are the basic building blocks of the Universe, and understanding their formation and evolution is crucial to many areas of current astrophysical research. Nearby galaxies contain the ‘‘fossil record’’ of the evolution of galaxies in great detail and provide a wealth of detail to comprehensively test existing galaxy formation and evolution models. The structure of a galaxy is linked to both its mass and evolutionary history. Although galaxies show a great deal of variety, we think that their current structures are principally determined by their masses, environment, and available amounts of gas (e.g., Sheth et al. 2013).
Galaxies are known to contain supermassive black holes (e.g., Ferrarese & Merritt 2000), whose masses correlate with the masses of their bulges, implying that the processes of forming bulges and supermassive black holes are intimately connected (Magorrian et al. 1998; Tremaine et al. 2002). These supermassive black holes are probably located in the nuclei of all galaxies. A small fraction of galaxies also has a very bright nucleus called an active galactic nucleus (AGN), showing excess emission thought to be due to accretion of mass by the supermassive black hole that exists at the center of the galaxy. It is thought that AGN play a significant role during the formation of galaxies by creating large outflows that quench star formation in the galaxy (Kormendy & Ho 2013). The complex central regions of active and inactive galaxies are thus an ideal laboratory for studying the evolution and formation of galaxies.
Active galactic nuclei can be defined in several ways at essentially all wavelengths such as X-rays, mid-infrared (mid-IR), radio detections, and optical emission line diagnostics. A number of spectroscopic surveys of nuclei of nearby galaxies have been performed (e.g., Heckman 1980; Ho et al. 1995) and large surveys of the local universe such as the 2 degree field survey (Colless et al. 2003) and the Sloan Digital Sky Survey (SDSS; York et al. 2000) have characterized properties of AGNs with an unprecedented statistical accuracy (e.g., Kauffmann et al. 2003; Heckman et al. 2004; Kewley et al. 2006; Schawinski et al. 2007). Optical spectroscopic surveys of local galaxies reveal that the nuclear activity in nearby galaxies is generally weak and shows a dichotomy with Hubble type. Emission line ratio diagnostics indicate that two-thirds of early-type and early-type spiral galaxies (E-Sb) and only about 15% of late-type galaxies (Sc-Sd) host some kind of active nuclei (Palomar survey; Ho 2008). Summed over all Hubble types, 40% of nearby galaxies can be considered active on the basis of optical spectroscopy.
At near-infrared (near-IR) wavelengths (2–5 μm) AGN also show prominent emission. A good tool to examine this AGN feature are JHKL (1–3.8 μm) color diagrams, since stellar and nonstellar emission of galaxy nuclei are located in different areas of in these diagrams (Glass & Moorwood 1985; Alonso-Herrero et al. 1998). The infrared color-color diagrams are a useful method to realize whether reddening is affecting the colors and to discover whether an infrared excess may be present. Nearby active nuclei show a near-IR excess in comparison to normal nuclei, which are dominated by stellar and star formation emission (de Grijp et al. 1987; Gallimore et al. 2010). The near-IR emission of active nuclei can be explained as arising from either hot dust or a power-law (nonthermal) spectral energy distribution. The effects of dust extinction can be partially refined with using the near-IR data, but only up to some limit. Near-infrared surveys that only go to the K band are not effective to diagnose AGN because of stellar contamination.
Selection of AGN in the mid-IR allows the exploration of strong AGN and quasars whose optical and soft X-ray emission is hidden by dust (e.g., Lacy et al. 2004, 2007, 2015; Stern et al. 2005, 2012; Martínez-Sansigre et al. 2005; Donley et al. 2012; Eisenhardt et al. 2012). Mid-infrared selection has the robust characteristic that it provides an opportunity for the selection of samples of AGNs containing both moderately obscured and unobscured objects of similar bolometric luminosities. This allows for an estimatation of the importance of the obscured AGN population to the AGN population as a whole (Lacy et al. 2015). In the mid-IR, the presence and absence of infrared emission features associated with polycyclic aromatic hydrocarbons (PAHs) and high-ionization infrared lines (Laurent et al. 2000) ensure strong AGN diagnostics.
Surveys that could in principle be used to find AGN in galaxies are the Infrared Astronomical Satellite (IRAS; Neugebauer et al. 1984), Deep Near Infrared Survey of the Southern Sky (DENIS; Epchtein et al. 1994; Paturel et al. 2003), Two Micron All Sky Survey (2MASS; Skrutskie et al. 2006), and more recently the Wide-field Infrared Survey Explorer (WISE; Wright et al. 2010). However, the spatial resolution of the IRAS data at 12, 25, 60, and 100 μm is too low (∼1′ or lower). DENIS and 2MASS observed the sky at wavelengths of 2 μm and below: most of the emission these surveys detect from galaxies comes from stars, making it difficult to detect light from the AGN. There have not been any comprehensive infrared spectroscopic surveys designed to find nearby active galaxies.
This all changed with the Spitzer Space Telescope and – at somewhat lower resolution – the WISE mission. The past few years have seen numerous actual studies using Spitzer and WISE observations to find and study AGN at high redshift. There are various mid-IR color selections, such as the Spitzer two-color criteria in Lacy et al. (2004), 2007), Stern et al. (2005), and Donley et al. (2012), the WISE two-color criteria in Jarrett et al. (2011) and Mateos et al. (2012), and the WISE one-color criteria of Stern et al. (2012) and Assef et al. (2013). All of these, using different AGN samples, are in rough agreement with each other and distinguish AGN cleanly from stars and star-forming galaxies in the mid-IR color space. Mid-infrared selection has the robust characteristic that it permits the selection of samples of AGN containing both moderately obscured and unobscured objects of similar bolometric luminosities, which allows an estimate to be made of the importance of the obscured AGN population to the AGN population. It should be noted however that mid-IR color selection of AGN is far from complete (e.g., Radcliffe 2019).
Radio continuum selection is one of the original ways to find AGN. Whether or not in combination with radio jets, compact, flat spectrum, high brightness temperature radio cores are a defining feature of an accreting galactic nucleus (Mushotzky et al. 2004). At the same time, care must be taken in interpreting low-resolution data, as weak extended radio emission can draw from star formation. Most radio data have fairly accurate positions (better than 45″ for the largest radio survey, the National Radio Astronomical Observatory VLA Sky Survey (NVSS), and better than 7″ for the most sensitive large solid angle survey, the Faint Images of the Radio Sky at Twenty-Centimeters (FIRST), allowing counterparts in other wavelength bands to be readily identified.
The Spitzer Infrared Array Camera (IRAC) study of Stern et al. (2005) showed that for unresolved AGN the [3.6]–[4.5] mid-IR color was considerably redder than for non-AGN or stars (Eisenhardt et al. 2004). Building further upon van der Wolk (2011), we set out to use the nuclear mid-IR [3.6]–[4.5] color selection, that is, the hot-core selection, in an attempt to uncover obscured and non-obscured actively accreting central black holes in the large extended galaxies of the S4G galaxy sample. This Spitzer Survey of Stellar Structure in Galaxies, S4G, is specifically designed to answer the need for a deep, large and uniform infrared survey of nearby galaxies (see Sheth et al. 2010 for the full survey description).
This paper is organized as follows: Sect. 2 briefly describes the mid-IR hot-core selection method applied to a well-studied sample of nearby galaxies. Section 3 describes the S4G data and sample construction. Section 4 describes our data analysis; we subsequently deal with the AGN fraction in the S4G sample, the relation between galaxy luminosity and the presence of an AGN, and confirmation of these findings with WISE data. Section 5 presents the discussion and conclusions. In Appendix A we present the Spitzer and WISE color comparison, followed by lists of the AGN defined from the Spitzer central colors in Appendix B.
2. Mid-infrared detection method applied to nearby galaxies
To illustrate the hot-core method, in Fig. 1 we first show the [3.6]–[4.5] versus [3.6]–[8.0] color-color diagram for the sample of 24 Sa spiral galaxies observed as part of the SAURON survey (de Zeeuw et al. 2002; Peletier et al. 2007; Falcón-Barroso et al. 2006; Shapiro et al. 2008). This sample is supplemented with four well-known nearby AGN: M 51/NGC 5194 (Seyfert), M 87/NGC 4486/3C 274 (radio-loud LINER), M 81/NGC 3031 (Seyfert), and M 104/NGC 4594 (Sombrero-galaxy: LINER); see Table 1. It is readily seen that three SAURON spirals stand out: NGC 2273, NGC 4235, and NGC N4293. The nuclei of these three are indeed known to display luminous radio cores in high-resolution 15 GHz VLA images (Nagar et al. 2005). It is also seen that the red nuclei in the four Messier AGN host galaxies stand out, but we note that the red core emission in M 87 must be attributed to strong nonthermal (synchrotron) radiation. We subsequently explore this infrared color selection for the extensive S4G galaxy sample.
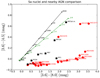 |
Fig. 1. Spitzer color-color diagram. SAURON Sa sample nuclei are plotted in red and nearby Messier AGN in black. For M 87, the colors of the large-scale jet at knots A/B denoted as M87 jet, the stellar emission at the same radius as the jet (M87 gal), and the stellar-subtracted jet emission (M87jet, ns) are also indicated. Black bodies at various temperatures are plotted with a black line. Power-law models νFν ∝ να at various spectral indices 0 ≤ α ≤ 3 are plotted with a green line. |
Properties of a few well-known nearby active galaxies.
3. Data and sample construction
In this study we used the S4G (Sheth et al. 2010) sample of 2352 nearby galaxies, for which deep [3.6] and [4.5] micron images have been reduced and archived in collaboration with the DAGAL EU ITN network (Detailed Anatomy of GALaxies)1, supplemented by the S4G Extension2 sample of 464 galaxies. The S4G is a volume, magnitude, and size-limited survey of nearby galaxies, with deep Infrared Array Camera (IRAC; Fazio et al. 2004) imaging at 3.6 and 4.5 μm; it is one of the Spitzer Legacy Programs of late-type galaxies. This survey contains galaxies within 40 Mpc (v < 3000 km s−1) away from the galactic plane (|b| > 30°), with extinction corrected B-band magnitude brighter than 15.5 and B-band diameter larger than 1′ with distances determined from HI radial velocities. We note that the fact that HI velocities are required means that many early-type galaxies are excluded and for this reason the S4G Extension was observed.
We applied the hot-core method to the S4G galaxies with the aim to detect AGN by studying the central [3.6]–[4.5] color. We examined 2816 galaxies and obtained the central [3.6]–[4.5] color for 2741 galaxies in total. The nuclear [3.6] and [4.5] magnitudes were measured with an aperture of three pixels. We measured the Spitzer colors using the IRAF3apphot package. The Spitzer IRAC pixel size is 1.22″ for all bands, yielding a measurement aperture of 3.66″ in both bands. In this way we expect to be able to find AGN in a uniform way, without suffering from dust attenuation. The candidate AGN comprise galaxies of all Hubble types, allowing us to investigate the dependence of the AGN fraction upon Hubble type. We subsequently investigated whether these candidate AGN have radio detections. We used catalogs of large area radio surveys to check for the presence of radio counterparts.
In addition to Spitzer data, we also used data from the Wide-field Infrared Survey Explorer (WISE). The WISE instrument has mapped the whole sky in four infrared bands W1, W2, W3, and W4 centered at 3.4, 4.6, 12, and 22 μm. We used WISE to obtain two extra colors for the S4G galaxies, namely [W1–W2] and [W2–W3]. Band W4 was not used, given the large point spread function. The pixel size of WISE is 1.37″ for all bands, giving a minimum aperture of 5.48″. The central colors of the galaxies are measured for WISE. We downloaded WISE images of the S4G galaxies for these three bands from the WISE Image Service 4. This analysis is similar to the Spitzer analysis, but has a factor ∼3 lower spatial resolution. Its results are presented in Appendix A.
In the next sections we study the AGN fraction in the S4G survey using the Spitzer IRAC images. We then examine the fraction of AGN detected in this way that have detections in the radio from VLA FIRST5 and NVSS6. Finally, we also investigate the dependence of the AGN fraction on morphological types from the Third Reference Catalogue of Bright Galaxies (de Vaucouleurs et al. 1991) and the HyperLeda database7.
4. Analysis
We determined the central colors for all S4G galaxies and obtained candidate AGN using the nuclear Spitzer IRAC [3.6]–[4.5] colors. When doing the photometry, we eliminated saturated, shapeless (irregular) galaxies and additionally a few galaxies for which the field was dominated by foreground stars. We analysed IRAC images of 2816 galaxies in total and eliminated 75 of these images, yielding a final sample of 2741 galaxies.
4.1. Fractions of AGNs in the S4G sample and their radio properties
The near- to mid-IR regime provides a very good window to determine stellar masses because the light emitted at these wavelengths is dominated by K- and M-type giant stars, tracing the older stellar populations. As extinction is a strong function of wavelength, any stellar light emitted in the mid-IR is significantly less affected by dust extinction than in the optical or shorter wavelengths. Querejeta et al. (2015) used S4G galaxies, revealed the old stellar flux at 3.6 μm, and obtained stellar mass maps for more than 1600 galaxies in their work. These authors also separated the dominate light from old stars and dust emission, which can significantly contribute to the observed 3.6 μm flux using the method described by Meidt et al. (2014) before.
Emission from PAHs and hot dust can significantly contribute to the flux detected at 3.6 μm and 4.5 μm in particular from the 3.3 μm PAH feature and hot dust arising around AGN (Meidt et al. 2012). In the absence of PAH continuum, the [3.6]–[4.5] color is generally as low as [3.6]–[4.5] ≤ 0.15 (Querejeta et al. 2015, Peletier et al. 2012; Norris et al. 2014). Querejeta et al. (2015) modeled the color of a galaxy consisting of a stellar component, together with a component of hot dust (and PAHs). These authors conclude that the fraction of the emission in the [3.6] bands is not realistically larger than 0.4 in the S4G sample, which implies that galaxies without AGN, even starburst galaxies, rarely reach [3.6]–[4.5] colors as red as 0.3.
In this paper we apply a stringent infrared color criterion: we only consider those galaxies with central colors [3.6]–[4.5] ≥ 0.5. We subsequently investigate which of the AGN candidates have also been detected in the radio surveys. Examining the AGN detection rates as a function of morphological type, we classify these types into three main groups: early-type galaxies (T-type −6, −5, −4, −3, −2, −1, 0), early-type spirals (T-type 1, 2, 3, 4, 5), and late-type spirals (T-type 6, 7, 8, 9, 10).
In Table 2, we list the percentages and numbers of AGN (defined as having central [3.6]–[4.5] ≥ 0.5) and non-AGN ([3.6]–[4.5] < 0.5) according to morphological types. Of the S4G galaxies, 1.3% appear to have [3.6]–[4.5] colors redder than 0.5 mag. This fraction is 0.8% for early types, 2.4% for early-type spiral galaxies, and 0.5% for late-type spiral galaxies. We also list the fractions of non-AGNs.
Fractions of AGN for the whole sample and the various morphological types listed separately.
The 36 AGN are listed in Table B.1; well-known Seyfert galaxies NGC 1068, NGC 4052, and NGC 4151 are clearly detected. The nuclear mid-IR color [3.6]–[4.5] is seen to range from 0.5 up to 1.6. Table 2 shows that the AGN detection fraction is more prominent in early-type spirals than in late-type spirals or early-type galaxies. This corresponds favorably to our expectations (e.g., Heckman & Best 2014): ellipticals (such as M 87) host AGN of the inefficient accretion type (FR1, or radio mode class); these objects lack dusty tori and hence have little or no dust to reradiate the accretion disk luminosity. The spirals on the other hand develop low-luminosity (low-mass black holes) AGN of efficient accretion (Seyfert-like), which do have dusty tori. Since early-type spirals have more massive bulges than late-type spirals, the former can produce more AGN power. Most importantly, the numbers of AGN are small, implying that LINERS (low-ionization nuclear emission-line regions) and other weak AGN types are not detected in this way.
We now investigate whether these objects have radio continuum counterparts. The presence of a compact radio core in particular is a good indicator of the presence of an AGN, since its radio emission is mostly from nonthermal origin, that is, not related to star formation (Ho 1999). Radio surveys are sensitive and generally have very accurate positional information. We examine radio data from the low-resolution (45″) VLA NVSS, and the high-resolution (5″) VLA FIRST survey. If no radio flux for an infrared-selected candidate AGN is known, it does not necessarily mean that its radio flux is too low to be detected, but it is also possible that it has not been observed, given the limited sky coverage of the relevant radio survey. The NVSS covered the sky north of −40°, whereas the FIRST sky extends from −10° to +65°. The former encompasses a large part of the S4G: 2514 of the 2741 galaxies are within the NVSS sky; for FIRST that number is 1711 out of 2741. Table 3 lists the numbers of S4G sample galaxies with detections in the combined and in the two separate radio surveys. For NVSS we used a search radius of 45″ and for FIRST we used a search radius of 35″. There is obviously considerable overlap: most FIRST sources also appear in the NVSS catalog, but the reverse is not true.
Fraction of the S4G galaxies detected in 2 radio surveys.
Table 3 indicates that 42% of the [3.6]–[4.5] color measured S4G galaxies are detected in radio surveys. We separate these galaxies as hot-core (candidate AGN) and cold-core (candidate non-AGN) in Table 4. It is seen that 87.9% of the hot-core galaxies and 41.4% of the cold-core galaxies are detected in the radio surveys. Most interesting is the difference between the low-resolution NVSS and the high-resolution FIRST survey. Whereas both of these surveys detect comparable (high) fractions of candidate AGN, NVSS appears to resolve out many diffuse candidate non-AGN, confirming their proposed classification. These differing fractions for the two individual radio surveys are illustrated in the histograms of Fig. 2. This figure also shows that the fractions of AGN that we detect in radio are very high, but significantly below 100%, suggesting that our hot-core method also finds radio-quiet AGN; these issues require further study. The tables show that about 19% of the infrared-detected candidate AGN have never before been detected as AGN in radio surveys. Also with reference to NGC 4235 in Fig. 1, we note that a less stringent red color cut, for instance 0.3 instead of 0.5, undoubtedly yields more AGN candidates.
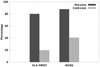 |
Fig. 2. Fraction of Spitzer detected candidate AGN ([3.6]–[4.5] ≥ 0.5) also detected in other surveys for VLA FIRST and NVSS (in dark colors in the histogram). Light colors in the histogram refer to the candidate non-AGN ([3.6]–[4.5] < 0.5). |
Fractions and numbers of hot- and cold-core galaxies detected in the two radio surveys.
Table B.1 lists the various hot-core AGN, detected and/or undetected in the radio bands. The infrared detected candidate AGN that remain undetected in radio surveys are shown in bold-face font.
4.2. Relation between galaxy luminosity and the presence of an AGN
We now study the question of whether the presence of an AGN depends on the absolute magnitude of the host galaxy. The absolute magnitude can be seen as a proxy of the galaxy stellar mass, which should correlate with the dynamical mass (through, e.g., scaling relations like the Tully-Fisher relation).
In Fig. 3, we plot the 2271 S4G sample galaxies with absolute magnitudes at 3.6 μm (Sheth et al. 2011) as a function of their optical morphological type. We now examine these detection rates as a function of morphological type. We indicate the 36 hot-core AGN and the radio undetected among these. For galaxies without absolute magnitudes at 3.6 μm we use the Ks magnitudes from the 2MASS All Sky Extended Catalog (XSC)8, converted to absolute magnitude using the distance modules from the NED9 database applying an average color K-[3.6] of 0.0 (see Falcón-Barroso et al. 2011).
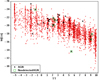 |
Fig. 3. Absolute magnitudes at 3.6 μm (M[3.6]) for the S4G sample galaxies vs. morphological types (TT). The black triangle symbols refer to 36 AGN with [3.6]–[4.5] ≥ 0.5 and the green big square symbols refer to AGN defined from their central colors [3.6]–[4.5] ≥ 0.5 not detected in radio. |
The 36 AGN in general seem to be bright compared to the rest of the galaxies in our sample and the majority of the AGN are spirals (as mentioned earlier). We find that the AGN are detected in the galaxies with the largest magnitudes/stellar masses. This is expected if the ratio of the red nucleus to the total galaxy luminosity is constant, since in this case the fainter AGN is not detected. To test this, we also plot this ratio against morphological type. In Fig. 4 we show 2271 S4G sample galaxies with the relative luminosity at 3.6 μm of the central source as a function of morphological type. We indicate the 34 hot-core AGN and the radio undetected among these. We see that this relative luminosity is rather constant. Although there is a tendency that the AGN are brighter in the NIR for early-type spirals, fainter AGN are also detected; this indicates that probably a strong type-dependent bias does not play a role. As mentioned in Sect. 4.1, the relative occurrence of nuclear accretion and its dust re-radiation are compared to the initial expectation.
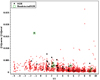 |
Fig. 4. Fraction of the light of the central source as a function of morphological type (TT). The black triangle symbols refer to 34 AGN with [3.6]–[4.5] ≥ 0.5 and the green big square symbols refer to AGN defined from their central colors [3.6]–[4.5] ≥ 0.5 not detected in radio. |
4.3. Confirmation with WISE data
In addition to Spitzer colors, we also obtained WISE colors for our sample galaxies. The results of the comparison are shown in Appendix A. It is seen that despite the poorer WISE resolution, all Spitzer-identified AGN stand out as red [W1]–[W2] (Fig. A.1). We subsequently applied the Mingo et al. (2016) WISE color classification to indicate the host galaxy type of the S4G sample, both the AGN candidates and the non-AGN, in Fig. A.2. The equivalence of our Spitzer AGN selection and the Mingo et al. (2016) WISE AGN classification is clearly seen. Moreover, Spitzer detects AGNs that the WISE diagnostic describe as ULIRG/obscured AGN. Again, as above, dusty spiral galaxies dominate as hosts for these low-luminosity AGNs.
5. Discussion and conclusions
We investigated the central Spitzer [3.6]–[4.5] colors of 2741 galaxies of the S4G and the S4G extension sample to study the presence of AGN in nearby galaxies using a method inspired by Stern et al. (2005). We conclude that galaxies with central colors [3.6]–[4.5] ≥0.5 are likely to be AGN. They have very red cores, which we attribute to AGN-heated circumnuclear dust.
We compared our results with the literature. As mentioned earlier, summed over all Hubble types 40% of the galaxies can be considered active (Ho 2008). The nearby galaxy survey of Kauffmann et al. (2003) examined the properties of the host galaxies of 22 623 narrow-line, obscured AGN with 0.02 < z < 0.3 selected from a complete sample of 122 808 galaxies from the SDSS (York et al. 2000; Stoughton et al. 2002). Kauffmann et al. (2003) reported an overall AGN fraction of ∼20%, of which ∼10% are Seyferts, based on the optical survey of the SDSS. These authors focused on the luminosity of the [O III] λ5007 emission line as a tracer of the strength of activity in nucleus. They show that the majority of AGN in their sample fall into the “transition” class, having line ratios intermediate between those of star-forming galaxies and those of LINERs or Seyferts. The authors show that low-luminosity AGN have old stellar populations similar to those of early-type galaxies. High-luminosity AGN reside in significantly younger hosts, that is in ordinary late-type galaxies. In our study, measuring the color excess of a sample of S4G galaxies, we find an AGN fraction of 1.3%. Of S4G galaxies, 42% are detected in radio surveys and 88% of those are also detected in radio surveys as a hot-core AGN candidate. Our detection statistics are not as high as optical spectroscopic surveys, but using the near-IR selection method with radio comparison is also effective to find AGN. Besides that, our AGN detection fraction is more prominent in early-type spirals than in late-type spirals or early-type galaxies. We find AGN that have infrared-bright tori, and most of these mid-IR selected AGN have early-type spiral host galaxies. Our survey obviously fails to detect AGN in early type hosts, as these lack dust.
Recently Kauffmann (2018) published a study of AGN that were selected using the infrared method described in this paper. This author examines the narrow emission-line properties and stellar populations of a sample of 1385 radio-detected, mid-IR excess AGNs to understand the physical conditions in the interstellar medium of these objects. This author compares these systems with a control sample of 50 000 AGNs selected by their optical emission-line ratios that do not have a significant mid-IR excess. Starting with a sample of SDSS (with redshifts up to 0.5), and combining these with the AllWISE survey (Wright et al. 2010), the author finds that, although most of the optically defined AGN are blue in the [W1]–[W2], there is an extended tail toward the very red [W1]–[W2], that is, AGN that we define in this work. The author reports a surprisingly large fraction of normal galaxies with very red central colors, as we do in this paper. Although most of the objects are too far away to resolve spatially, Kauffmann (2018) finds, for the nearest galaxies, that radio luminosity is the quantity that is most predictive of a redder central [W1]–[W2] color. Of the radio-detected AGN, 80% would also be optically classified as an AGN. Kauffmann (2018) concludes that the more detailed studies support the view that galaxies with centrally peaked mid-IR emission are those in which black hole growth may be occurring in a mode that is largely hidden at optical wavelengths, and that black hole growth may be modulated/regulated by energetic feedback from relativistic jets generated by the accreting black hole. Our paper is complementary to this paper; the AGN statistics (88%) determined by the near-IR color excess method with radio survey counterpart detection used in our work is higher, since we are studying the statistical properties of a nearby sample, using the higher spatial resolution Spitzer data, confirming some of the main results of Kauffmann (2018).
The nearby active nuclei show a near-IR excess in comparison to normal nuclei that are dominated by evolved stellar and star formation emission. This gives rise to the interpretation that this excess is connected to supermassive black hole accretion. The near-IR emission of active nuclei can be described as arising from either hot circumnuclear dust or a nonthermal power-law spectral distribution. The sources with this excess all have compact radio cores with high brightness temperatures (van der Wolk 2011). The mid-IR emission shows that these hot dust components are often surrounded by warm dust tori, which are particularly found in luminous radio-loud AGN (Meisenheimer et al. 2001; Ogle et al. 2006). In our work, we find the fraction of AGN with a strong near-IR [3.6]–[4.5] color excess. Of these AGN, 88% are detected in the archives of radio surveys, respectively. This reveals that these AGN have compact radio cores and also have bright infrared obscuring torus.
We pre-classified our sources based on their mid-IR colors, using the WISE color/color plot and the classification of Mingo et al. (2016), as elliptical, spiral, starburst, and AGN. The sources we found as AGN with Spitzer were almost all confirmed using WISE data.
Star formation histories of spiral galaxies show that star formation occurs as circumnuclear starbursts in the spiral galaxies; the highest star formation rates are in early-type spiral galaxies and possibly related to the presence of bar and often co-occurs with an AGN (Kormendy & Kennicutt 2004; Knapen et al. 2006). The existence of almost bulgeless, late spiral galaxies provides a clue that undisturbed galaxies exist. Active galactic nuclei, for which matter needs to flow into the center, are uncommon in bulgeless galaxies, and in galaxies with bulges (Ho 2008). Apparently, as spiral galaxies get older their bulges and nuclear supermassive black holes are increasingly fed by material from the disk. In our work, we find that the fraction of infrared-defined AGN is highest for early-type spiral galaxies in the nearby universe, in apparent agreement with the high star formation rates for such galaxies.
We showed that the Spitzer Space Telescope is a efficient, powerful tool for studying AGN demographics. The color-color method represents an efficient way of distinguishing AGN from normal galaxies and an efficient way of finding AGN in a large sample. These diagnostics can prove to be extremely useful for large AGN and galaxy samples and can help develop ways to efficiently classify objects when data from the next generation of instruments become available.
Acknowledgments
Tuba İkiz acknowledges a PhD scholarship from The Scientific and Technological Research Council of Turkey (TÜBİTAK) under project number 1059B141400919 and 1649B031406125 and is supported by the Atatürk University. This publication is based on observations obtained with the Spitzer Space Telescope, which is operated by the Jet Propulsion Laboratuary, California Institute of Technology, under a contract with the National Aeronautics and Space Administration (NASA) and the Wide-field Infrared Survey Explorer, which is a joint project of the University of California, Los Angeles, and the Jet Propulsion Laboratory/ California Institute of Technology, funded by the National Aeronautics and Space Administration (NASA). We wish to thank Guido van der Wolk for contributions to improve the paper. We would like to thank the DAGAL team for their great work to make S4G sample data public and available. We would like to thank the hospitality of Kapteyn Astronomical Institute. This research has made use of the NASA/IPAC Extragalactic Database (NED) which is operated by JPL, Caltech, under contract with NASA. We acknowledge the use of the FIRST and NVSS catalogues, provided by NRAO. We thank the anonymous referee for insightful and constructive comments that greatly improved the paper. We would like to thank the SUNDIAL ITN network for support. RFP acknowledges financial support from the European Union’s Horizon 2020 research and innovation program under the Marie Sklodowska-Curie Grant agreement No. 721463 to the SUNDIAL ITN network We also thank the TOPCAT developer Mark Taylor for programming and releasing a software patch so that we could improve our figures.
References
- Alonso-Herrero, A., Simpson, C., Ward, M. J., & Wilson, A. S. 1998, ApJ, 495, 196 [NASA ADS] [CrossRef] [Google Scholar]
- Assef, R. J., Stern, D., Kochanek, C. S., et al. 2013, ApJ, 772, 26 [NASA ADS] [CrossRef] [Google Scholar]
- Crane, P. C., & van der Hulst, J. M. 1992, AJ, 103, 1146 [NASA ADS] [CrossRef] [Google Scholar]
- de Grijp, M. H. K., Lub, J., & Miley, G. K. 1987, A&AS, 70, 95 [NASA ADS] [Google Scholar]
- de Vaucouleurs, G., de Vaucouleurs, A., Corwin, Jr., H. G., et al. 1991, Third Reference Catalogue of Bright Galaxies. Volume I: Explanations and references. Volume II: Data for galaxies between 0h and 12h. Volume III: Data for galaxies between 12h and 24h [Google Scholar]
- de Zeeuw, P. T., Bureau, M., Emsellem, E., et al. 2002, MNRAS, 329, 513 [NASA ADS] [CrossRef] [Google Scholar]
- Donley, J. L., Koekemoer, A. M., Brusa, M., et al. 2012, ApJ, 748, 142 [NASA ADS] [CrossRef] [Google Scholar]
- Eisenhardt, P. R., Stern, D., Brodwin, M., et al. 2004, ApJS, 154, 48 [NASA ADS] [CrossRef] [Google Scholar]
- Eisenhardt, P. R. M., Wu, J., Tsai, C.-W., et al. 2012, ApJ, 755, 173 [NASA ADS] [CrossRef] [EDP Sciences] [Google Scholar]
- Epchtein, N., de Batz, B., Copet, E., et al. 1994, Ap&SS, 217, 3 [NASA ADS] [CrossRef] [Google Scholar]
- Falcón-Barroso, J., Bacon, R., Bureau, M., et al. 2006, MNRAS, 369, 529 [Google Scholar]
- Falcón-Barroso, J., van de Ven, G., Peletier, R. F., et al. 2011, MNRAS, 417, 1787 [NASA ADS] [CrossRef] [Google Scholar]
- Fazio, G. G., Hora, J. L., Allen, L. E., et al. 2004, ApJS, 154, 10 [NASA ADS] [CrossRef] [Google Scholar]
- Ferrarese, L., & Merritt, D. 2000, ApJ, 539, L9 [NASA ADS] [CrossRef] [Google Scholar]
- Gallimore, J. F., Yzaguirre, A., Jakoboski, J., et al. 2010, ApJS, 187, 172 [NASA ADS] [CrossRef] [Google Scholar]
- Glass, I. S., & Moorwood, A. F. M. 1985, MNRAS, 214, 429 [NASA ADS] [CrossRef] [Google Scholar]
- Gürkan, G., Hardcastle, M. J., & Jarvis, M. J. 2014, MNRAS, 438, 1149 [NASA ADS] [CrossRef] [Google Scholar]
- Heckman, T. M. 1980, A&A, 500, 187 [Google Scholar]
- Heckman, T. M., & Best, P. N. 2014, ARA&A, 52, 589 [Google Scholar]
- Heckman, T. M., Kauffmann, G., Brinchmann, J., et al. 2004, ApJ, 613, 109 [NASA ADS] [CrossRef] [Google Scholar]
- Ho, L. C. 1999, ApJ, 510, 631 [NASA ADS] [CrossRef] [Google Scholar]
- Ho, L. C. 2008, ARA&A, 46, 475 [Google Scholar]
- Ho, L. C. 2009, ApJ, 699, 626 [NASA ADS] [CrossRef] [Google Scholar]
- Ho, L. C., Filippenko, A. V., & Sargent, W. L. 1995, ApJS, 98, 477 [NASA ADS] [CrossRef] [Google Scholar]
- Ho, L. C., Filippenko, A. V., & Sargent, W. L. W. 1997, ApJS, 112, 315 [NASA ADS] [CrossRef] [Google Scholar]
- Jarrett, T. H., Cohen, M., Masci, F., et al. 2011, ApJ, 735, 112 [Google Scholar]
- Kauffmann, G. 2018, MNRAS, 480, 3201 [NASA ADS] [CrossRef] [Google Scholar]
- Kauffmann, G., Heckman, T. M., Tremonti, C., et al. 2003, MNRAS, 346, 1055 [Google Scholar]
- Kewley, L. J., Groves, B., Kauffmann, G., & Heckman, T. 2006, MNRAS, 372, 961 [NASA ADS] [CrossRef] [Google Scholar]
- Knapen, J. H., Mazzuca, L. M., Böker, T., et al. 2006, A&A, 448, 489 [NASA ADS] [CrossRef] [EDP Sciences] [Google Scholar]
- Kormendy, J., & Ho, L. C. 2013, ArXiv e-prints [arXiv:1308.6483] [Google Scholar]
- Kormendy, J., & Kennicutt, R. C., Jr 2004, ARA&A, 42, 603 [NASA ADS] [CrossRef] [Google Scholar]
- Lacy, M., Storrie-Lombardi, L. J., Sajina, A., et al. 2004, ApJS, 154, 166 [NASA ADS] [CrossRef] [Google Scholar]
- Lacy, M., Petric, A. O., Sajina, A., et al. 2007, AJ, 133, 186 [Google Scholar]
- Lacy, M., Ridgway, S. E., Sajina, A., et al. 2015, ApJ, 802, 102 [NASA ADS] [CrossRef] [EDP Sciences] [Google Scholar]
- Laurent, O., Mirabel, I. F., Charmandaris, V., et al. 2000, A&A, 359, 887 [NASA ADS] [Google Scholar]
- Magorrian, J., Tremaine, S., Richstone, D., et al. 1998, AJ, 115, 2285 [NASA ADS] [CrossRef] [Google Scholar]
- Martínez-Sansigre, A., Rawlings, S., Lacy, M., et al. 2005, Nature, 436, 666 [NASA ADS] [CrossRef] [Google Scholar]
- Mateos, S., Alonso-Herrero, A., Carrera, F. J., et al. 2012, MNRAS, 426, 3271 [NASA ADS] [CrossRef] [Google Scholar]
- Meidt, S. E., Schinnerer, E., Knapen, J. H., et al. 2012, ApJ, 744, 17 [NASA ADS] [CrossRef] [Google Scholar]
- Meidt, S. E., Schinnerer, E., van de Ven, G., et al. 2014, ApJ, 788, 144 [NASA ADS] [CrossRef] [Google Scholar]
- Meisenheimer, K., Haas, M., Müller, S. A. H., et al. 2001, A&A, 372, 719 [NASA ADS] [CrossRef] [EDP Sciences] [Google Scholar]
- Mingo, B., Watson, M. G., Rosen, S. R., et al. 2016, MNRAS, 462, 2631 [NASA ADS] [CrossRef] [Google Scholar]
- Mushotzky, R. 2004, in Supermassive Black Holes in the Distant Universe, ed. A. J. Barger, Astrophys. Space Sci. Lib., 308, 53 [NASA ADS] [CrossRef] [Google Scholar]
- Nagar, N. M., Falcke, H., & Wilson, A. S. 2005, A&A, 435, 521 [NASA ADS] [CrossRef] [EDP Sciences] [Google Scholar]
- Neugebauer, G., Habing, H. J., van Duinen, R., et al. 1984, ApJ, 278, L1 [Google Scholar]
- Norris, M. A., Meidt, S., Van de Ven, G., et al. 2014, ApJ, 797, 55 [NASA ADS] [CrossRef] [Google Scholar]
- Ogle, P., Whysong, D., & Antonucci, R. 2006, ApJ, 647, 161 [NASA ADS] [CrossRef] [Google Scholar]
- Paturel, G., Petit, C., Rousseau, J., & Vauglin, I. 2003, A&A, 405, 1 [NASA ADS] [CrossRef] [EDP Sciences] [Google Scholar]
- Peletier, R. F., Falcón-Barroso, J., Bacon, R., et al. 2007, MNRAS, 379, 445 [NASA ADS] [CrossRef] [Google Scholar]
- Peletier, R. F., Kutdemir, E., van der Wolk, G., et al. 2012, MNRAS, 419, 2031 [NASA ADS] [CrossRef] [Google Scholar]
- Querejeta, M., Meidt, S. E., Schinnerer, E., et al. 2015, ApJS, 219, 5 [NASA ADS] [CrossRef] [Google Scholar]
- Radcliffe, J. 2019, PhD Thesis, University of Groningen, The Netherlands [Google Scholar]
- Schawinski, K., Thomas, D., Sarzi, M., et al. 2007, MNRAS, 382, 1415 [NASA ADS] [CrossRef] [Google Scholar]
- Shapiro, K. L., Genzel, R., Förster Schreiber, N. M., et al. 2008, ApJ, 682, 231 [NASA ADS] [CrossRef] [Google Scholar]
- Sheth, K., Regan, M., Hinz, J. L., et al. 2010, PASP, 122, 1397 [NASA ADS] [CrossRef] [Google Scholar]
- Sheth, K., Regan, M., Hinz, J. L., et al. 2011, VizieR Online Data Catalog: J/PASP/122/1397 [Google Scholar]
- Sheth, K., Armus, L., Athanassoula, E., et al. 2013, Not Dead Yet! Completing Spitzer’s Legacy with Early Type Galaxies (Spitzer Proposal) [Google Scholar]
- Skrutskie, M. F., Cutri, R. M., Stiening, R., et al. 2006, AJ, 131, 1163 [NASA ADS] [CrossRef] [Google Scholar]
- Stern, D., Eisenhardt, P., Gorjian, V., et al. 2005, ApJ, 631, 163 [NASA ADS] [CrossRef] [Google Scholar]
- Stern, D., Assef, R. J., Benford, D. J., et al. 2012, ApJ, 753, 30 [NASA ADS] [CrossRef] [Google Scholar]
- Stoughton, C., Lupton, R. H., Bernardi, M., et al. 2002, AJ, 123, 485 [NASA ADS] [CrossRef] [Google Scholar]
- Tremaine, S., Gebhardt, K., Bender, R., et al. 2002, ApJ, 574, 740 [NASA ADS] [CrossRef] [Google Scholar]
- van der Wolk, G. 2011, PhD Thesis, University of Groningen, The Netherlands [Google Scholar]
- Wang, F. 2003, PhD Thesis, The University of Texas at Austin, USA [Google Scholar]
- Wright, E. L., Eisenhardt, P. R. M., Mainzer, A. K., et al. 2010, AJ, 140, 1868 [Google Scholar]
- Yang, X. H., Chen, P. S., & Huang, Y. 2015, VizieR Online Data Catalog, 744 [Google Scholar]
- York, D. G., Adelman, J., Anderson, J. E., Jr, et al. 2000, AJ, 120, 1579 [CrossRef] [Google Scholar]
Appendix A: Spitzer and WISE color comparison
In this Appendix we show the WISE [W1]–[W2] versus [W2]–[W3] color-color plot in Fig. A.1 and the activity diagnostics in Fig. A.2 based on Mingo et al. (2016) classification in Table A.1, for our S4G galaxy sample. The equivalence of our Spitzer hot-core selection and the Mingo et al. (2016) AGN classification using WISE [W1]–[W2] color is clearly demonstrated. We note that IC 0630 is an AGN according to its WISE data, but is missing in the Spitzer AGN list owing to saturation. Reversely, NGC 0253 is a Spitzer AGN, but not a WISE AGN, owing to saturation.
 |
Fig. A.1. WISE [W1]–[W2] color vs. [W2]–[W3] color magnitude density diagram for the S4G sample. The black symbols refer to Spitzer detected AGN [3.6]–[4.5] ≥ 0.5. |
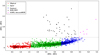 |
Fig. A.2. [W1]–[W2] vs. [W3]–[W3] color – color magnitude diagram for the galaxies in S4G sample. The symbols are based on the Mingo et al. (2016) classification of Table A.1, whereby ULIRG/obscured AGN with ([W1]–[W2] > 0.5, [W3]–[W3] ≥ 4.4) are indicated with pink symbols. |
We pre-classified the S4G sources using the scheme of Mingo et al. (2016); the resulting color/color diagram is shown in Fig. A.2. We used Table A.1, taken from Mingo et al. (2016), which describes in detail the class boundaries (see, e.g., the source distributions on the equivalent WISE color-color plots of Gürkan et al. (2014), Yang et al. (2015)). We classified our sources using these boundaries and also show the sources that are not described by Mingo et al. (2016) with pink symbols. The latter group refers to ULIRG/obscured AGNs ([W1]–[W2] > 0.5, [W3]–[W3] ≥ 4.4). All sources we find as an AGN candidate on the basis of their Spitzer color [3.6]–[4.5] > 0.5 mag can also be classified as such on the basis of their WISE color.
Activity table based on Mingo et al. (2016).
Appendix B: Spitzer and WISE colors of the S4G sample
In this Appendix, we present a list of the radio detected and non-detected AGN in related radio surveys (FIRST, NVSS) with [3.6]–[4.5] ≥ 0.5 mag for the S4G sample. For Table B.1 column 1 gives the galaxy names, column 2-3 contains their right ascension and declination in degrees at epoch J2000.0, in column 4 we indicate the numerical morphological type, in columns 5–10 we gives the [3.6]–[4.5], [W1]–[W2], and [W3]–[W3] colors with their errors, in column 11 we present galaxies as “detected” and “not detected” in radio surveys, and in column 12 we indicate the radio surveys of detected or non-detected galaxies, respectively.
AGN defined using their central Spitzer colors [3.6]–[4.5] ≥ 0.5.
All Tables
Fractions of AGN for the whole sample and the various morphological types listed separately.
Fractions and numbers of hot- and cold-core galaxies detected in the two radio surveys.
All Figures
|
Fig. 1. Spitzer color-color diagram. SAURON Sa sample nuclei are plotted in red and nearby Messier AGN in black. For M 87, the colors of the large-scale jet at knots A/B denoted as M87 jet, the stellar emission at the same radius as the jet (M87 gal), and the stellar-subtracted jet emission (M87jet, ns) are also indicated. Black bodies at various temperatures are plotted with a black line. Power-law models νFν ∝ να at various spectral indices 0 ≤ α ≤ 3 are plotted with a green line. |
| In the text | |
|
Fig. 2. Fraction of Spitzer detected candidate AGN ([3.6]–[4.5] ≥ 0.5) also detected in other surveys for VLA FIRST and NVSS (in dark colors in the histogram). Light colors in the histogram refer to the candidate non-AGN ([3.6]–[4.5] < 0.5). |
| In the text | |
|
Fig. 3. Absolute magnitudes at 3.6 μm (M[3.6]) for the S4G sample galaxies vs. morphological types (TT). The black triangle symbols refer to 36 AGN with [3.6]–[4.5] ≥ 0.5 and the green big square symbols refer to AGN defined from their central colors [3.6]–[4.5] ≥ 0.5 not detected in radio. |
| In the text | |
|
Fig. 4. Fraction of the light of the central source as a function of morphological type (TT). The black triangle symbols refer to 34 AGN with [3.6]–[4.5] ≥ 0.5 and the green big square symbols refer to AGN defined from their central colors [3.6]–[4.5] ≥ 0.5 not detected in radio. |
| In the text | |
|
Fig. A.1. WISE [W1]–[W2] color vs. [W2]–[W3] color magnitude density diagram for the S4G sample. The black symbols refer to Spitzer detected AGN [3.6]–[4.5] ≥ 0.5. |
| In the text | |
|
Fig. A.2. [W1]–[W2] vs. [W3]–[W3] color – color magnitude diagram for the galaxies in S4G sample. The symbols are based on the Mingo et al. (2016) classification of Table A.1, whereby ULIRG/obscured AGN with ([W1]–[W2] > 0.5, [W3]–[W3] ≥ 4.4) are indicated with pink symbols. |
| In the text | |
Current usage metrics show cumulative count of Article Views (full-text article views including HTML views, PDF and ePub downloads, according to the available data) and Abstracts Views on Vision4Press platform.
Data correspond to usage on the plateform after 2015. The current usage metrics is available 48-96 hours after online publication and is updated daily on week days.
Initial download of the metrics may take a while.