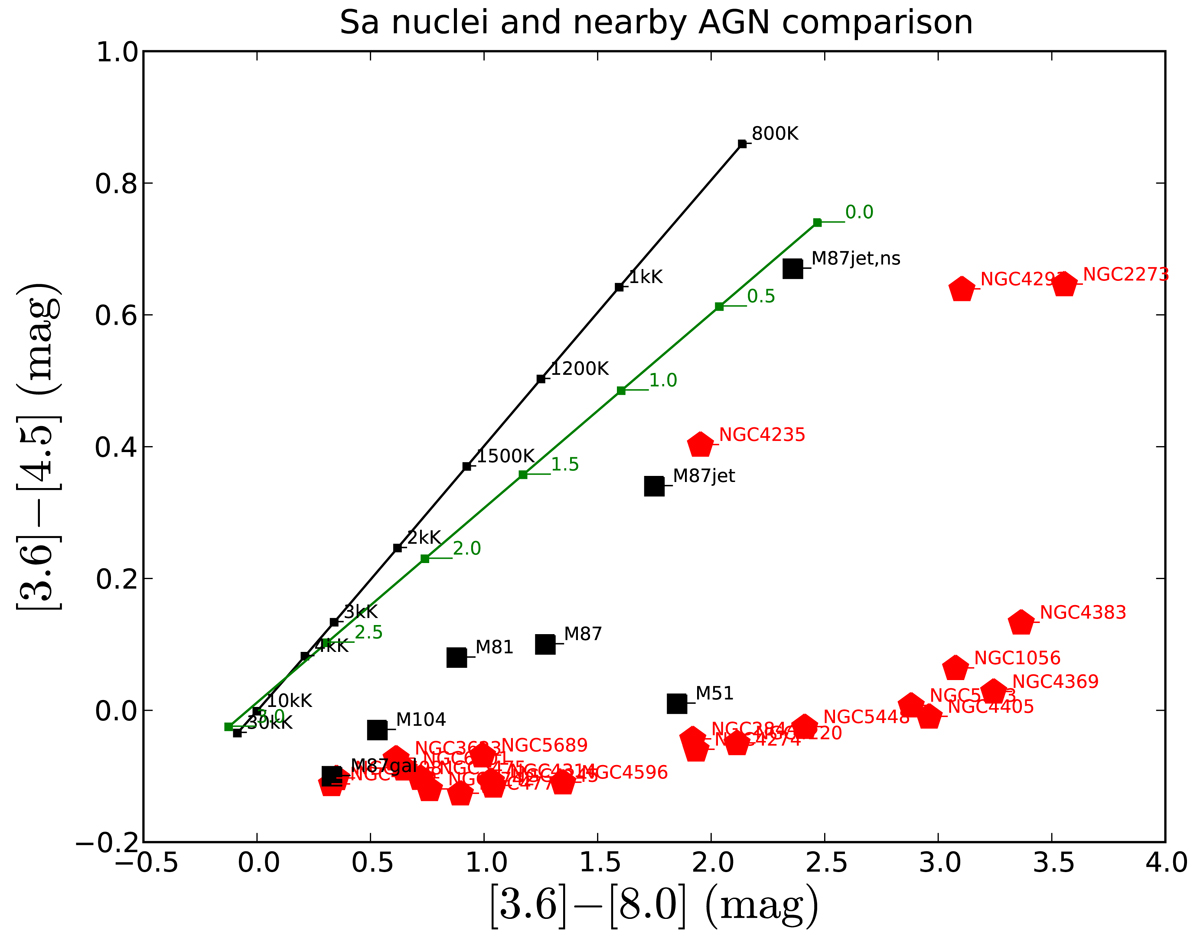
Fig. 1.

Spitzer color-color diagram. SAURON Sa sample nuclei are plotted in red and nearby Messier AGN in black. For M 87, the colors of the large-scale jet at knots A/B denoted as M87 jet, the stellar emission at the same radius as the jet (M87 gal), and the stellar-subtracted jet emission (M87jet, ns) are also indicated. Black bodies at various temperatures are plotted with a black line. Power-law models νFν ∝ να at various spectral indices 0 ≤ α ≤ 3 are plotted with a green line.
Current usage metrics show cumulative count of Article Views (full-text article views including HTML views, PDF and ePub downloads, according to the available data) and Abstracts Views on Vision4Press platform.
Data correspond to usage on the plateform after 2015. The current usage metrics is available 48-96 hours after online publication and is updated daily on week days.
Initial download of the metrics may take a while.


