| Issue |
A&A
Volume 639, July 2020
|
|
|---|---|---|
| Article Number | L12 | |
| Number of page(s) | 6 | |
| Section | Letters to the Editor | |
| DOI | https://doi.org/10.1051/0004-6361/202038599 | |
| Published online | 20 July 2020 | |
Letter to the Editor
NLTE modeling and spectroscopically derived abundances of lithium and beryllium for classical nova ejecta⋆
1
Dipartimento di Fisica “Enrico Fermi”, Universitá di Pisa, and INFN – Sezione di Pisa, largo B.Pontecorvo 3, 56127 Pisa, Italy
e-mail: shore@df.unipi.it
2
Hamburger Sternwarte, Universität Hamburg, Gojenbergsweg 112, 21029 Hamburg, Germany
Received:
6
June
2020
Accepted:
18
June
2020
Context. Extreme super-solar abundances of lithium and beryllium have been reported in recent years for classical novae based on absorption lines in ultraviolet and optical spectra during the optically thick stages, but these findings have not been compared with spectrum syntheses of the ejecta.
Aims. We present a grid of nova ejecta models calculated with PHOENIX aimed at simulating the reported Li I and Be II features with super-solar abundances.
Methods. We computed a sequence of models, finely exploring the parameter space of effective temperature, ejecta expansion velocity, and Li and Be overabundances.
Results. Regardless of temperature and expansion velocity, the synthetic spectra for large Li and Be overabundances strongly disagree with those presented in recent literature. Assuming a wide range of Be overabundances (factors of 100 to 10 000 relative to solar), we predict a much stronger spectroscopic feature at Be II 3130 Å than those so far observed. A similar overabundance for Li would instead result in a barely observable change in the emitted flux at Li I 6709 Å. The observed extended absorption feature at 3131 Å reported in V838 Her and other novae appears even in zero-Be models with only solar abundances (which for novae are underestimates).
Conclusions. The computed spectra do not support the lithium and beryllium abundances, and caution is warranted in the interpretation of the phenomenology.
Key words: novae / cataclysmic variables / Galaxy: abundances / nuclear reactions / nucleosynthesis / abundances / methods: numerical
The spectrum models are only available at the CDS via anonymous ftp to cdsarc.u-strasbg.fr (130.79.128.5) or via http://cdsarc.u-strasbg.fr/viz-bin/cat/J/A+A/639/L12
© ESO 2020
1. Introduction
The nucleosynthetic origin of 7Li in the Milky Way has been a subject of intense interest for decades (Iliadis 2015). Spectroscopic studies show that the abundance of lithium in Population II stars is approximately an order of magnitude greater than in Population I stars. Several classes of objects have been identified as potential lithium sources in the Galaxy, among which are supernovae, asymptotic branch giants, and red giants (Reeves 1994). Nova explosions also enrich their neighboring environment with light to heavy elements expelled during the outburst (Gehrz et al. 1998). The role of lithium (and beryllium) in the nuclear reactions network leading to the outbreak and ejection of the hydrogen-rich accretion layer on the white dwarf is theoretically well defined (Hernanz et al. 1996; Jose 2016). 7Be is produced from the reaction of 3He with 4He, and it decays into 7Li through electron capture with a half-time of approximately 53 days (Bahcall & Moeller 1969; Iliadis 2015).
Several spectroscopic campaigns of recent novae have noted the presence of absorption lines in UV and optical spectra that have been identified as 7Be II and 7Li I (Tajitsu et al. 2015; Izzo et al. 2015; Selvelli et al. 2018; Molaro et al. 2020). The abundances were derived using a simplified escape probability (curve of growth) approach, identifying enriched individual structures by matching absorption lines between elements of presumably similar ionization (Friedjung 1979). Although the principal tracers of the species are both resonance lines, Li I 6707 Å and Be II 3132 Å, they arise from different ionization states and, consequently, different portions of the ejecta. They are also accompanied by very different spectral contaminants, depending on the wavelength interval and velocity structure of the ejecta.
To date, no theoretical studies have been published aimed at simulating these observations. This is a serious lacuna since attributing a nucleosynthetic Galactic contribution to classical novae depends on understanding the spectroscopic signatures. This is the purpose of our paper.
2. Methods
We computed a grid of models with the general-purpose stellar atmosphere code PHOENIX (Hauschildt et al. 1994, 1997) in its 1D mode (version 18.02). In each model, we assumed the ejecta to be spherically symmetric, homogeneous, and in ballistic motion (Hauschildt et al. 1995). Thus, the radial gas density law, ρ(r) ∝ r−3, where r is the radial distance from the white dwarf, results from the imposed linear velocity law, v(r) ∝ r, and constant ejecta mass. The element abundances are identical at each radius. Each model was computed using 64 layers defined by the optical depth, which ranges from 103 (the deepest layer in the model) to 10−10 (the outermost layer). PHOENIX allows the NLTE treatment of level populations for a specified set of ions and ionization stages. For this work we treated the following atomic species in full NLTE1: H I (30 levels), He I (19 levels), He II (10 levels), Li I (232 levels), Li II (55 levels), Be I (84 levels), Be II (75 levels), C I–IV (958 levels, total), N I–IV (674 levels, total), O I–IV (736 levels, total), Mg I–IV (692 levels, total), Ca I–III (457 levels, total), Fe I–IV (2997 levels, total); LTE was assumed to apply to the other atomic species. No molecules were included. The models were snapshots of the ejecta development, no explicit time dependence was included, and the (constant) luminosity of the illuminating white dwarf was assumed to be 5 × 10⁴ L⊙ in all simulations. The effective radius of the atmosphere (i.e., the physical radius of the layer with optical depth unity that corresponds to the pseudo-photosphere) is then defined by the Stefan–Boltzmann law. The flux at the inner boundary, which is at very large continuum optical depth, is specified by initially scaling a blackbody spectrum in temperature from the pseudo-photosphere inward in radius and then performing the temperature corrections iteratively. Consequently, the precise form is not important because the emergent energy distribution is calculated self-consistently (see, e.g., Hauschildt et al. 1997). We did not include the effective radius as a parameter in the model grid because previous works showed that it does not have a relevant impact on the line formation (Hauschildt 2008). We explored a range of effective temperatures, from 10 000 to 20 000 K, in steps of 1000 K. The maximum expansion velocity, vmax, ranged from 1500 to 5000 km s−1, in steps of 500 km s−1. Both ranges are typical of novae during this stage and similar to those in the literature for those novae in which the identifications have been reported. The models were converged to within ≤1% in temperature and ≈3% in departure coefficients in the co-moving frame, and the observer frame spectrum was then produced.
The model elemental abundances of lithium and beryllium were chosen between the solar photospheric values (Asplund et al. 2005), respectively 1.05 and 1.38 (logarithmic relative to H = 12), to +5 dex compared to the solar, in steps of +1 dex, and a series of model with effectively no Li or Be (abundance set at 0.01 dex). We did not correct the abundances of any other elements to formally maintain the sum of the abundances by mass, X + Y + Z = 1. However, even with the highest Li and Be abundances considered, the error induced in the abundances is not greater than 10−6 compared to hydrogen (i.e., at least an order magnitude smaller than the convergence tolerance adopted for the models; more below). The models used 9Be II (i.e., the stable isotope), but the above-mentioned studies claim detection of 7Be II (Tajitsu et al. 2015). The velocity separation between doublets of the two Be II isotopes, about 20 km s−1, is less than the velocity resolution of the model (approximately 50 km s−1, given the adopted 0.5 Å wavelength resolution in the range between 2000 and 10 000 Å), and we therefore ignore this discrepancy in our simulations.
We also computed a limited set of solar composition models to simulate low velocity gradient ejecta, with Teff of 12 000, 15 000, and 18 000 K using vmax of 100 and 200 km s−1. Since the ejecta are assumed to in free expansion with a linear velocity law, a power-law mass density distribution, and chemically homogeneous, we can use these assumptions to simulate the narrow lines in a shell. Such structures have been identified in classical novae from long time series in the optical and UV (e.g., De Gennaro Aquino et al. 2014, Shore et al. 2016, Mason et al. 2018), appearing as persistent features in radial velocity whose optical depths scale with the expansion2. These structures were shifted in radial velocity by amounts similar to those in Tajitsu et al. (2015), Izzo et al. (2015), or Selvelli et al. (2018), on the order of 1000–1200 km s−1. Since we are solving the radiative transfer problem within an imposed dynamical framework, we can perform this shift. The only limitation in the comparison is that since we assume sphericity, the emission produced from this shell may not be the same as the more filamentary nature inferred from the “stationary” late-time absorption features.
Model parameters.
The singular importance of the claimed Be II detection is that it would be from 7Be, which is produced during the thermonuclear runaway and is β-unstable. The lithium would therefore correspond to 7Li, which is the direct decay product. Two results have been presented in the published studies. First, the Be II detection implies a massive overabundance of the isotope. Second, changes in the line strengths comparing two epochs is taken as evidence of an abundance decrease since it seems faster than would be expected from the expansion of the ejecta alone based on comparisons with narrow features in Ca II over a relatively narrow range of radial velocity. It is important to note that not every feature in the Ca II K line has a correlated feature in either the Li I or Be II line.
3. Results
We present here the results of our models focusing on the spectral properties of lithium and beryllium, more specifically the behavior of the lines 9Be II 3131 Å and 7Li I 6709 Å.
Concerning the computed NLTE departure coefficients (i.e., the ratio between the actual population density of an atomic level against the expected LTE population at given density and temperature; Hubeny & Mihalas 2014), the models show large differences from unity (values ranging from 10 to 10−3) for the adopted lithium and beryllium levels.
3.1. Be II 3131 Å
The spectral interval containing the Be II lines is extremely complex. The effect of blending is shown in Fig. 1, where the gray curve shows a model with the same effective temperature as the red and black curves, but differing in the maximum expansion velocity. The most prominent features are the pseudo-P Cyg troughs produced by the line blending for the maximum expansion velocity of 2500 km s−1 relative to that at 200 km s−1. Since the ejecta were assumed to be spherical and homogeneous, the fine structure detected in high resolution optical and ultraviolet spectra cannot be captured.
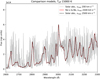 |
Fig. 1. Three different models with the same effective temperature Teff = 15 000 K and vmax = 200 km s−1 and solar metallicity (gray), vmax = 2500 km s−1 and no Li and Be (red), vmax = 2500 km s−1 and solar metallicity (black dashed). The red and black lines overlap almost perfectly. |
However, a comparison (Fig. 2) with the IUE spectrum of the extreme ONe nova V838 Her (Selvelli et al. 2018) shows that the feature at 3131 Å cannot be unambiguously interpreted as Be II. The models for a Be overabundance of 4 dex show an extremely strong absorption, only a fraction of which is contributed by the Be II doublet, and more significantly it also shows an emission feature that is not observed in the V838 Her comparisons. The model’s assumed sphericity produces the emission so it could be suppressed in a strongly nonspherical ejection, but the absorption depth is not affected by the geometry, and the model profiles for enhanced Be are much stronger than observed. In contrast, with no enhancement the pseudo-P Cyg trough is well reproduced by just the solar composition. Since the model is not aimed at specifically reproducing all features of the spectrum, no adjustments have been made in this comparison; the failure at Mg II is entirely due to the assumed abundances. We also note that some of the contributors to the 3131 Å absorption are from species that are enhanced in ONe novae, so this feature, even without beryllium, is likely underestimated.
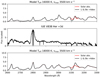 |
Fig. 2. Comparison between models and the V838 Her IUE spectrum (+3d after discovery, middle panel). The red curves in the top and bottom panels represent models with solar abundances, vmax = 3500 km s−1 and Teff of 16 000 and 18 000 K, respectively, while the black curves show models with identical temperature and expansion velocity but Li and Be abundances 10 000 times solar. |
Similarly to V838 Her, the comparison in Fig. 3 between an early spectrum (i.e., +5d after discovery) from Nova Cir 2018 and a solar abundance model shows that we could reproduce a P Cyg-like feature at the 3131 Å without invoking super-solar beryllium abundances.
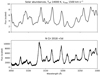 |
Fig. 3. Comparison between two models: (top panel) with solar metallicity, vmax = 1500 km s−1, and Teff = 14 000 K; (bottom panel) a Nova Cir 2018 spectrum (+5d after discovery). |
Moreover, we can see in Fig. 1 that the spectra from models featuring solar abundances are basically indistinguishable from those characterized by a Li and Be abundance set at +0.01 dex, further suggesting that the pseudo-P Cyg feature at 3131 Å may not originate from Be II.
To illustrate the effect of discrete filamentary structures at fixed radial velocity, we show in Fig. 4 a simulation combining a 15 000 K model with a maximum velocity of 2500 km s−1 with a structure with a 100 km s−1 gradient shifted by 1100 km s−1. The latter value was taken from Tajitsu et al. (2015). We again note that the figure is not attempting to precisely reproduce the observations, but to highlight the ambiguity. Matches are actually achieved with a number of displacements between −500 and −1500 km s−1. For display purposes, we used a 80:20% ratio of the high to low velocity components. The features are produced by many contributors. It is important to note that the coupling between transitions across species are naturally accounted for within the fully NLTE treatment.
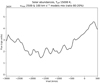 |
Fig. 4. Line profile centered on 3131+Å for a mixed model realized with the sum of the spectra from the model with Teff = 15 000 K and vmax = 2500 km s−1 (solar metallicity) and the model with Teff = 15 000 K and vmax = 2500 km s−1 (also solar metallicity), the latter being shifted 1100 km s−1 blueward. The two spectra have been added with a 80:20% ratio. |
3.2. Li I 6709 Å
The models cannot produce an observable Li I line at the temperature and density conditions inferred in the literature. Lithium is too ionized in any of the models to yield a detectable feature stronger than a few percent. The feature is limited to the lowest velocity of the ejecta, where the density is highest. Were the line to arise in a knot, with a high density contrast relative to the rest of the material, it would have to be isolated in both velocity and space (essentially the same for ballistic ejecta) and very highly enriched relative to the rest of the matter. We do not have indications of such strong differential enhancement of the filaments detected in high resolution studies of classical novae (Shore et al. 2013; Mason et al. 2018).
4. Discussion
Our purpose in this study is not to disprove the reported identifications, but to show that the inferences regarding abundances are not unique and to urge caution. Interpreting the strengths of the individual features using an analogy to the interstellar curve of growth or a shell-like “reversing layer” is misleading. Nova ejecta in the optically thick stage, during which the published spectra were obtained, are very structured with large variations in the absorption depths. We know that the maximum phase of the optical light curve is an epoch when the ejecta are very opaque, especially in the UV, and the complexity of line formation is at its highest. Different transitions of even a single ion couple across a broad range of velocities, hence radial distances within the ejecta, and the absorption line variations do not reflect time-dependent dynamics (De Gennaro Aquino et al. 2014). We should note that the optical depth of the lines for the highest published abundances are so large that the Be II feature would be completely saturated and, unless they have a minuscule covering factor, cannot produce narrow features. The line widths in ballistic ejecta cannot exceed that given by their radial extension (i.e., Δvrad ≈ vmaxΔr/R(t), where R(t) is the outer radius of the ejecta). This, in turn, relates to the covering factor. If the lines are saturated, as would be the case for the claimed overabundances of beryllium, the depth is proportional to the covering factor of the filament.
The NLTE levels and transitions data are based upon the Kurucz database http://kurucz.harvard.edu/atoms.html
Acknowledgments
We are grateful to Peter H. Hauschildt for supporting us in the computation of the models. We thank Jordi José, Giovanni Leidi, Elena Mason, and Marlies Meyer for encouragement and collaboration, and Pierluigi Selvelli for discussions. We also thank Luca Izzo, Paolo Molaro, and Sumner Starrfield for discussions during the meeting Lithium in the Universe: to Be or not to Be? 2019 Nov 18-22. The authors acknowledge the North-German Supercomputing Alliance (HLRN) for providing HPC resources that have contributed to the research results reported in this paper. For our work we have made use of NASA’s Astrophysics Data System. We thank to the python and LaTeX communities for developing and providing these invaluable tools. This study used data obtained from the ESO Science Archive Facility under request number 552477. Some of the data presented in this paper were obtained from the Mikulski Archive for Space Telescopes (MAST). STScI is operated by the Association of Universities for Research in Astronomy, Inc., under NASA contract NAS5-26555. Support for MAST for non-HST data is provided by the NASA Office of Space Science via grant NNX13AC07G and by other grants and contracts. Including appendix B was provoked by a very interesting question from the referee.
References
- Asplund, M., Grevesse, N., & Sauval, A. J. 2005, in Cosmic Abundancesas Records of Stellar Evolution and Nucleosynthesis, eds. I. Barnes, G. Thomas, & F. N. Bash, ASP Conf. Ser., 336, 25 [Google Scholar]
- Bahcall, J. N., & Moeller, C. P. 1969, ApJ, 155, 511 [NASA ADS] [CrossRef] [Google Scholar]
- De Gennaro Aquino, I., Shore, S. N., Schwarz, G. J., et al. 2014, A&A, 562, A28 [NASA ADS] [CrossRef] [EDP Sciences] [Google Scholar]
- Friedjung, M. 1979, A&A, 77, 357 [NASA ADS] [Google Scholar]
- Gehrz, R. D., Truran, J. W., Williams, R. E., & Starrfield, S. 1998, PASP, 110, 3 [NASA ADS] [CrossRef] [Google Scholar]
- Hauschildt, P. H. 2008, Classical Novae, 2nd edn., eds. M. F. Bode, & A. Evans (Cambridge University Press) [Google Scholar]
- Hauschildt, P. H., Starrfield, S., Austin, S., et al. 1994, ApJ, 422, 831 [CrossRef] [Google Scholar]
- Hauschildt, P. H., Starrfield, S., Shore, S. N., Allard, F., & Baron, E. 1995, ApJ, 447, 829 [NASA ADS] [CrossRef] [Google Scholar]
- Hauschildt, P. H., Baron, E., & Allard, F. 1997, ApJ, 483, 390 [NASA ADS] [CrossRef] [Google Scholar]
- Hernanz, M., Jose, J., Coc, A., & Isern, J. 1996, ApJ, 465, L27 [NASA ADS] [CrossRef] [Google Scholar]
- Hubeny, I., & Mihalas, D. 2014, Theory of Stellar Atmospheres: An Introduction to Astrophysical Non-equilibrium Quantitative Spectroscopic Analysis (Princeton University Press), Princeton Series Astrophys. [Google Scholar]
- Iliadis, C. 2015, Nuclear Physics of Stars (Wiley) [Google Scholar]
- Izzo, L., Della Valle, M., Mason, E., et al. 2015, ApJ, 808, L14 [NASA ADS] [CrossRef] [Google Scholar]
- Jose, J. 2016, Stellar Explosions: Hydrodynamics and Nucleosynthesis (CRC Press), Ser. Astron. Astrophys. [CrossRef] [Google Scholar]
- Mason, E., Shore, S. N., De Gennaro Aquino, I., et al. 2018, ApJ, 853, 27 [NASA ADS] [CrossRef] [Google Scholar]
- Molaro, P., Izzo, L., Bonifacio, P., et al. 2020, MNRAS, 492, 4975 [CrossRef] [Google Scholar]
- Reeves, H. 1994, Rev. Mod. Phys., 66, 193 [NASA ADS] [CrossRef] [Google Scholar]
- Selvelli, P., Molaro, P., & Izzo, L. 2018, MNRAS, 481, 2261 [CrossRef] [Google Scholar]
- Shore, S. N., De Gennaro Aquino, I., Schwarz, G. J., et al. 2013, A&A, 553, A123 [NASA ADS] [CrossRef] [EDP Sciences] [Google Scholar]
- Shore, S. N., Mason, E., Schwarz, G. J., et al. 2016, A&A, 590, A123 [NASA ADS] [CrossRef] [EDP Sciences] [Google Scholar]
- Tajitsu, A., Sadakane, K., Naito, H., Arai, A., & Aoki, W. 2015, Nature, 518, 381 [NASA ADS] [CrossRef] [Google Scholar]
Appendix A: Temperature dependency in the models
A sequence demonstrating the temperature dependence is shown in Figs. A.1 (for vmax = 2500 km s−1) and A.2 (100 km s−1). The narrowness of the individual features again yields ambiguous identifications, since several Fe II transitions are consistent with the range of velocities observed in similar ionization states during the same stage of the expansion. The decreased column density over time resulting from the expansion, without a change in velocity, is consistent with ballistic expansion, but does not distinguish which lines are responsible for the narrow features since different excitation conditions populate the transitions in time at different depths in the ejecta.
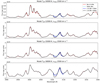 |
Fig. A.1. Comparison between models in the spectra range 2900 and 3300 Å. Top panel: four models with Teff = 10 000 K, vmax = 2500 km s−1, and respectively no Li and Be abundance (red), and 1 (cyan dashed), 100 (blue), and 10 000 (black) times solar Li and Be abundance. Second panel: same as top panel, but with Teff = 12 000 K. Third panel: same as top panel, but with Teff = 15 000 K. Bottom panel: same as top panel, but with Teff = 18 000 K. The red curves are barely visible because they follow the cyan dashed curves almost perfectly. |
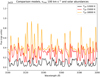 |
Fig. A.2. Comparison between models in the spectral range 3100 to 3200 Å. The three models were computed with solar metallicity, maximum expansion velocity vmax = 100 km s−1, and effective temperatures 12 000 K (black), 15 000 K (red) and 18 000 K (orange), respectively. |
Appendix B: Departure coefficients for the lowest levels of Li I and Be II
Figures B.1–B.8 show the departure coefficients, bi, for the first three levels of Li I and Be II for the two temperatures and abundances used for the models in Fig. 2, with respect to the optical depth. The lines are labeled in order of energy level (i.e., darker for higher levels). The level populations for Be II show a strong sensitivity to the elemental abundance at both temperatures, while those for Li I show none. This occurs because the Be+ ion is the dominant species at these temperatures, and an increase in the continuum optical depth increases the photoionization depletion of the ground state. For Li, instead, the neutral state is a trivial fraction of the ionic abundance and the optical depth is too small to show any reaction to changing the column density in the ion.
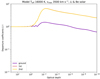 |
Fig. B.1. Li I departure coefficients for the Teff = 16 000 K, vmax = 3500 km s−1, solar metallicity model. |
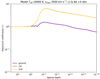 |
Fig. B.2. Li I departure coefficients for the Teff = 16 000 K, vmax = 3500 km s−1, Li and Be abundance +4 dex model. |
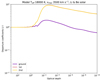 |
Fig. B.3. Li I departure coefficients for the Teff = 18 000 K, vmax = 3500 km s−1, solar metallicity model. |
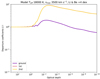 |
Fig. B.4. Li I departure coefficients for the Teff = 18 000 K, vmax = 3500 km s−1, Li and Be abundance +4 dex model. |
 |
Fig. B.5. Be II departure coefficients for the Teff = 16 000 K, vmax = 3500 km s−1, solar metallicity model. |
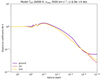 |
Fig. B.6. Be II departure coefficients for the Teff = 16 000 K, vmax = 3500 km s−1, Li and Be abundance +4 dex model. |
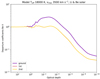 |
Fig. B.7. Be II departure coefficients for the Teff = 18 000 K, vmax = 3500 km s−1, solar metallicity model. |
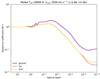 |
Fig. B.8. Be II departure coefficients for the Teff = 18 000 K, vmax = 3500 km s−1, Li and Be abundance +4 dex model. |
All Tables
All Figures
|
Fig. 1. Three different models with the same effective temperature Teff = 15 000 K and vmax = 200 km s−1 and solar metallicity (gray), vmax = 2500 km s−1 and no Li and Be (red), vmax = 2500 km s−1 and solar metallicity (black dashed). The red and black lines overlap almost perfectly. |
| In the text | |
|
Fig. 2. Comparison between models and the V838 Her IUE spectrum (+3d after discovery, middle panel). The red curves in the top and bottom panels represent models with solar abundances, vmax = 3500 km s−1 and Teff of 16 000 and 18 000 K, respectively, while the black curves show models with identical temperature and expansion velocity but Li and Be abundances 10 000 times solar. |
| In the text | |
|
Fig. 3. Comparison between two models: (top panel) with solar metallicity, vmax = 1500 km s−1, and Teff = 14 000 K; (bottom panel) a Nova Cir 2018 spectrum (+5d after discovery). |
| In the text | |
|
Fig. 4. Line profile centered on 3131+Å for a mixed model realized with the sum of the spectra from the model with Teff = 15 000 K and vmax = 2500 km s−1 (solar metallicity) and the model with Teff = 15 000 K and vmax = 2500 km s−1 (also solar metallicity), the latter being shifted 1100 km s−1 blueward. The two spectra have been added with a 80:20% ratio. |
| In the text | |
|
Fig. A.1. Comparison between models in the spectra range 2900 and 3300 Å. Top panel: four models with Teff = 10 000 K, vmax = 2500 km s−1, and respectively no Li and Be abundance (red), and 1 (cyan dashed), 100 (blue), and 10 000 (black) times solar Li and Be abundance. Second panel: same as top panel, but with Teff = 12 000 K. Third panel: same as top panel, but with Teff = 15 000 K. Bottom panel: same as top panel, but with Teff = 18 000 K. The red curves are barely visible because they follow the cyan dashed curves almost perfectly. |
| In the text | |
|
Fig. A.2. Comparison between models in the spectral range 3100 to 3200 Å. The three models were computed with solar metallicity, maximum expansion velocity vmax = 100 km s−1, and effective temperatures 12 000 K (black), 15 000 K (red) and 18 000 K (orange), respectively. |
| In the text | |
|
Fig. B.1. Li I departure coefficients for the Teff = 16 000 K, vmax = 3500 km s−1, solar metallicity model. |
| In the text | |
|
Fig. B.2. Li I departure coefficients for the Teff = 16 000 K, vmax = 3500 km s−1, Li and Be abundance +4 dex model. |
| In the text | |
|
Fig. B.3. Li I departure coefficients for the Teff = 18 000 K, vmax = 3500 km s−1, solar metallicity model. |
| In the text | |
|
Fig. B.4. Li I departure coefficients for the Teff = 18 000 K, vmax = 3500 km s−1, Li and Be abundance +4 dex model. |
| In the text | |
|
Fig. B.5. Be II departure coefficients for the Teff = 16 000 K, vmax = 3500 km s−1, solar metallicity model. |
| In the text | |
|
Fig. B.6. Be II departure coefficients for the Teff = 16 000 K, vmax = 3500 km s−1, Li and Be abundance +4 dex model. |
| In the text | |
|
Fig. B.7. Be II departure coefficients for the Teff = 18 000 K, vmax = 3500 km s−1, solar metallicity model. |
| In the text | |
|
Fig. B.8. Be II departure coefficients for the Teff = 18 000 K, vmax = 3500 km s−1, Li and Be abundance +4 dex model. |
| In the text | |
Current usage metrics show cumulative count of Article Views (full-text article views including HTML views, PDF and ePub downloads, according to the available data) and Abstracts Views on Vision4Press platform.
Data correspond to usage on the plateform after 2015. The current usage metrics is available 48-96 hours after online publication and is updated daily on week days.
Initial download of the metrics may take a while.