Fig. A.1.
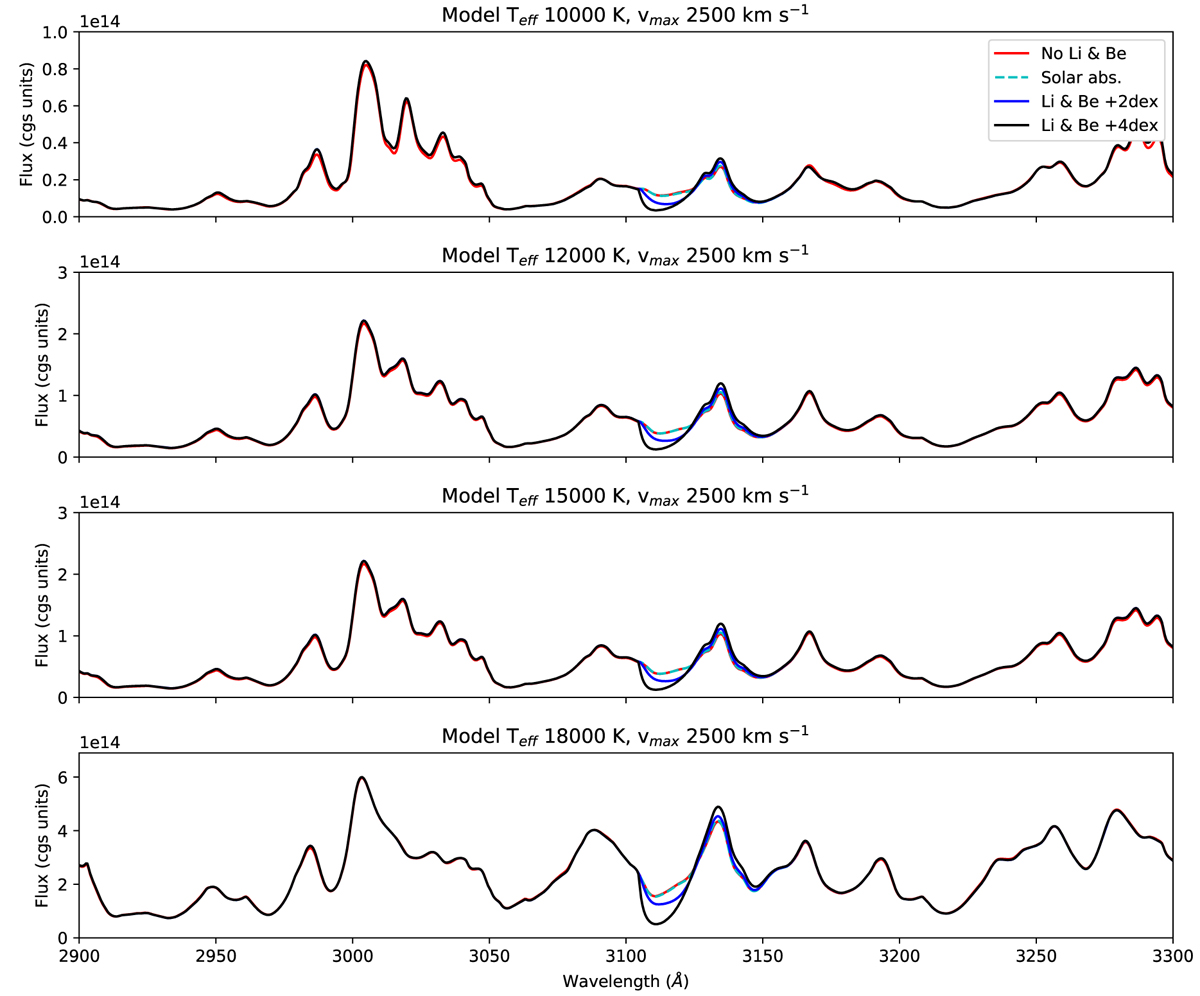
Comparison between models in the spectra range 2900 and 3300 Å. Top panel: four models with Teff = 10 000 K, vmax = 2500 km s−1, and respectively no Li and Be abundance (red), and 1 (cyan dashed), 100 (blue), and 10 000 (black) times solar Li and Be abundance. Second panel: same as top panel, but with Teff = 12 000 K. Third panel: same as top panel, but with Teff = 15 000 K. Bottom panel: same as top panel, but with Teff = 18 000 K. The red curves are barely visible because they follow the cyan dashed curves almost perfectly.
Current usage metrics show cumulative count of Article Views (full-text article views including HTML views, PDF and ePub downloads, according to the available data) and Abstracts Views on Vision4Press platform.
Data correspond to usage on the plateform after 2015. The current usage metrics is available 48-96 hours after online publication and is updated daily on week days.
Initial download of the metrics may take a while.