Fig. 2.
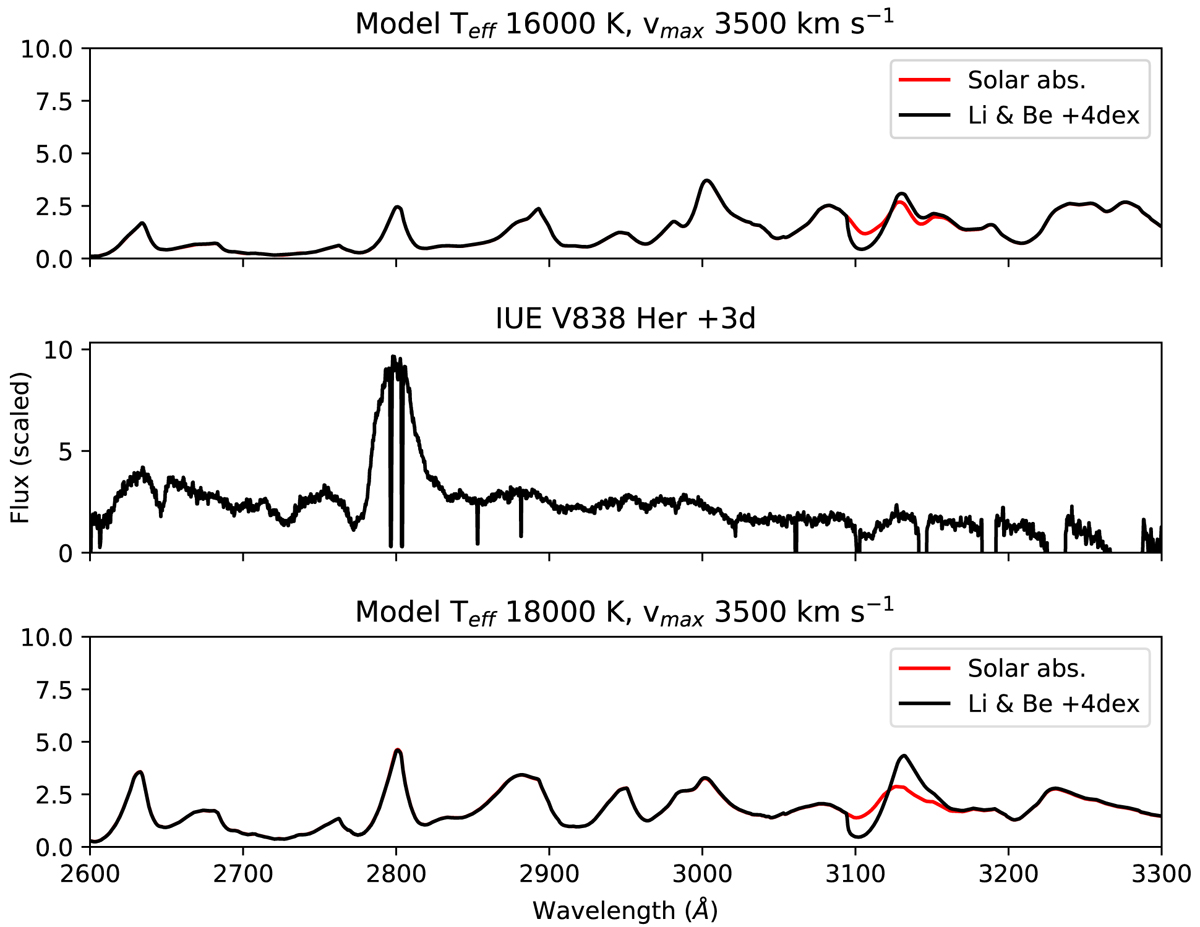
Comparison between models and the V838 Her IUE spectrum (+3d after discovery, middle panel). The red curves in the top and bottom panels represent models with solar abundances, vmax = 3500 km s−1 and Teff of 16 000 and 18 000 K, respectively, while the black curves show models with identical temperature and expansion velocity but Li and Be abundances 10 000 times solar.
Current usage metrics show cumulative count of Article Views (full-text article views including HTML views, PDF and ePub downloads, according to the available data) and Abstracts Views on Vision4Press platform.
Data correspond to usage on the plateform after 2015. The current usage metrics is available 48-96 hours after online publication and is updated daily on week days.
Initial download of the metrics may take a while.