| Issue |
A&A
Volume 639, July 2020
|
|
|---|---|---|
| Article Number | A100 | |
| Number of page(s) | 8 | |
| Section | Stellar structure and evolution | |
| DOI | https://doi.org/10.1051/0004-6361/202038165 | |
| Published online | 16 July 2020 | |
Rapid late-time X-ray brightening of the tidal disruption event OGLE16aaa
1
Centro de Astrobiología (CSIC-INTA), Departamento de Astrofísica, Camino Bajo del Castillo s/n, 28692 Villanueva de la Cañada, Madrid, Spain
e-mail: This email address is being protected from spambots. You need JavaScript enabled to view it.
2
Telespazio-Vega UK for ESA, Operations Department; European Space Astronomy Centre (ESAC), Camino Bajo del Castillo s/n, 28692 Villanueva de la Cañada, Madrid, Spain
Received:
14
April
2020
Accepted:
11
June
2020
Abstract
Stars that pass too close to a super-massive black hole may be disrupted by strong tidal forces. OGLE16aaa is one such tidal disruption event (TDE) which rapidly brightened and peaked in the optical/UV bands in early 2016 and subsequently decayed over the rest of the year. OGLE16aaa was detected in an XMM-Newton X-ray observation on June 9, 2016 with a flux slightly below the Swift/XRT upper limits obtained during the optical light curve peak. Between June 16–21, 2016, Swift/XRT also detected OGLE16aaa and based on the stacked spectrum, we could infer that the X-ray luminosity had jumped up by more than a factor of ten in just one week. No brightening signal was seen in the simultaneous optical/UV data to cause the X-ray luminosity to exceed the optical/UV one. A further XMM-Newton observation on November 30, 2016 showed that almost a year after the optical/UV peak, the X-ray emission was still at an elevated level, while the optical/UV flux decay had already leveled off to values comparable to those of the host galaxy. In all X-ray observations, the spectra were nicely modeled with a 50–70 eV thermal component with no intrinsic absorption, with a weak X-ray tail seen only in the November 30 XMM-Newton observation. The late-time X-ray behavior of OGLE16aaa strongly resembles the tidal disruption events ASASSN-15oi and AT2019azh. We were able to pinpoint the time delay between the initial optical TDE onset and the X-ray brightening to 182 ± 5 days, which may possibly represent the timescale between the initial circularization of the disrupted star around the super-massive black hole and the subsequent delayed accretion. Alternatively, the delayed X-ray brightening could be related to a rapid clearing of a thick envelope that covers the central X-ray engine during the first six months.
Key words: accretion / accretion disks / black hole physics / X-rays: galaxies / galaxies: individual: OGLE16aaa
© ESO 2020
1. Introduction
Super-massive black holes (SMBH) are found in the centers of galaxies and appear as active galactic nuclei (AGN) when they accrete matter (for a review see, e.g., Kormendy & Ho 2013; Heckman & Best 2014; Brandt & Alexander 2015). In recent years, thanks largely to the dedicated synoptic optical sky surveys, the number of galactic nuclei that have shown unexpectedly rapid optical and X-ray variability has increased dramatically. One such class of variables are tidal disruption events (TDE), which occur when a star passes so close to the SMBH that it gets ripped apart by strong tidal forces. A fraction of the disrupted star may end up in bound orbits, leading to strong optical, ultraviolet (UV) and X-ray emission when the fallback material first circularizes around and then falls onto the SMBH (Lacy et al. 1982; Rees 1988; Phinney et al. 1989; Evans & Kochanek 1989; Strubbe & Quataert 2009; Guillochon & Ramirez-Ruiz 2013).
The basic TDE models predict that after reaching its peak, the brightness evolution of a TDE should follow a power-law decay with an index of γ = −5/3 (Phinney et al. 1989; Rees 1990). The time scale in which the TDE light curve rises to its peak, as well as the mass fall-back rate, depend on the mass of the SMBH (Lodato et al. 2009; Guillochon & Ramirez-Ruiz 2013). Given that several TDEs follow these predictions rather well, the SMBH masses and the properties of the disrupted stars can be estimated by fitting the light curve (Mockler et al. 2019). However, in some cases, the optical/UV decay is not well described by these models. One pronounced outlier is ASASSN-15lh, which has shown a strong secondary optical/UV brightening (Leloudas et al. 2016). The TDE classification of ASASSN-15lh is not certain, however, as it might be a super-luminous supernova (Dong et al. 2016). Another strangely behaving TDE is AT 2018fyk/ASASSN-18ul, which showed a plateau phase after about 50 days into the start of the decline phase (Wevers et al. 2019). PS16dtm, a likely TDE in a Seyfert I galaxy, also exhibited a plateau phase that lasted for 100 days, while simultaneously having a X-ray luminosity that is a factor of 10 lower than historic levels, suggesting that the AGN was obscured by the TDE debris (Blanchard et al. 2017) or that the flow of material onto the AGN was disrupted by the interaction. PS16dtm showed a significant infrared excess during the TDE, perhaps due to reprocessing by a dusty torus in the vicinity of the SMBH (Jiang et al. 2017). Similar complex “TDE-like” variations can be seen in general from “changing-look AGN” in optical and X-rays (e.g., Trakhtenbrot et al. 2019) as well as in the infrared (Kankare et al. 2017), which means that care must be taken when identifying an event as a genuine TDE.
Among the X-ray bright TDE candidates, there are a few cases where significant X-ray re-brightening occurs months after the optical/UV peak. These TDEs have strong thermal X-ray spectral components, with similar temperatures, of about 50–100 eV, as other X-ray detected TDEs (e.g., Esquej et al. 2007; Miller et al. 2015; Lin et al. 2015; Holoien et al. 2018). ASASSN-15oi, for example, showed a factor of ten increase of the X-ray flux roughly six months after the optical/UV TDE peak, without any corresponding signal in the optical/UV light curve (Gezari et al. 2017; Holoien et al. 2018). During this period, the X-ray luminosity significantly exceeded the optical/UV one. Another TDE that shows puzzling X-ray activity is ASASSN-18jd; four months into the TDE decay, it showed a bright X-ray flare lasting only a week (Neustadt et al. 2020). Similar rapid late-time X-ray flares (or re-brightening events) were reported from AT2019azh (Liu et al. 2019; van Velzen et al. 2020). TDEs can also show relativistic jet activity in radio and X-rays, the best example being Swift J1644+57, which has a hard, power-law-like, “non-thermal” X-ray spectra (Bloom et al. 2011; Burrows et al. 2011; Tchekhovskoy et al. 2014).
This observational diversity is also accompanied by multiple theoretical models for TDEs, which build upon the debris fall-back scenarios (Rees 1988; Evans & Kochanek 1989). It has been suggested that the initial optical/UV TDE flare is not, in fact, related to accretion onto the SMBH but is, rather, generated by shocks during the initial circularization of the disrupted star around the SMBH (Piran et al. 2015; Krolik et al. 2016). An alternative view is that the X-ray source can be shrouded by the stellar debris or by an optically thick envelope that forms during an super-Eddington accretion episode onto the SMBH, and the X-rays are then re-processed into UV/optical light in this envelope (Loeb & Ulmer 1997; Strubbe & Quataert 2009; Metzger & Stone 2016). A thick re-processing torus can also be formed around the SMBH if the in-falling gas streams do not cool efficiently (Bonnerot et al. 2017). As many of these models predict different observational characteristics based on the viewing angle with respect to the newly formed debris disk, meaning an X-ray-bright TDE would correspond to a face-on view of a disk, while an X-ray-faint TDE would be viewed edge-on; thus, a unified model for TDEs has naturally emerged (Dai et al. 2018).
2. Observations of OGLE16aaa
2.1. Discovery and properties of OGLE16aaa
OGLE16aaa is a TDE candidate, whose discovery was reported by Wyrzykowski et al. (2017). It was detected on January 2, 2016 by the OGLE survey at the center of its host galaxy (Wyrzykowski et al. 2016). The PESSTO transient survey took an optical spectrum of it on January 17, 2016 (Firth et al. 2016; Wyrzykowski et al. 2017), showing a blue continuum with narrow optical emission lines of Hα, Hβ, N II, and O III at a common redshift of z = 0.1655 (Wyrzykowski et al. 2017). The optical spectrum resembles the TDE in SDSS J074820.66+471214.6 (Yang et al. 2013), and the line ratios suggested that both weak AGN activity and recent star formation were present in the galaxy (Wyrzykowski et al. 2017; Onori et al. 2019). OGLE16aaa also has rather typical values of rise and decay time scales as well as luminosities for a TDE (for comparison, see, van Velzen et al. 2020).
Mockler et al. (2019) used the MOSFit TDE models (Guillochon et al. 2018) to derive a black hole mass of  for OGLE16aaa. We used this value throughout our study. We applied the line-of-sight reddening of E(B − V) = 0.028 (Schlafly & Finkbeiner 2011) and the extinction law of Cardelli et al. (1989) with the REDDEN XSPEC model. We found the corresponding hydrogen column density of 1.9 × 1020 cm−2 using NH(cm−2) = (6.86 ± 0.27) × 1021 E(B − V) mag (Güver & Özel 2009), and use this value in XSPEC with the 2016 version of the TBABS model (Wilms et al. 2000). The adopted NH = 1.9 × 1020 cm−2 value is slightly smaller than the one obtained by HI4PI Collaboration (2016); NH ≈ 2.7 × 1020 cm−2. We also assume cosmological parameters derived by Planck Collaboration XIII (2016): Ωm = 0.308, H0 = 67.8 km s−1 Mpc−1, giving a luminosity distance of DL = 819.4 Mpc for a flat Universe.
In this study, we use the previously published, publicly available OGLE (Wyrzykowski et al. 2014) V-filter and I-filter light curves of OGLE16aaa1. The first three months of OGLE photometry were presented in Wyrzykowski et al. (2017), and these data were also utilized more recently by Mockler et al. (2019) and Jiang et al. (2019). We complement these observations with new Swift/UVOT observations taken in February 2020, as well as archival XMM-Newton X-ray and UV observations taken on June 9, 2016 and November 30, 2016.
2.2. Swift observations
OGLE16aaa was observed with the Neil Gehrels Swift Observatory (Swift hereafter; Gehrels et al. 2004) on multiple occasions from January 2016 onward (see Wyrzykowski et al. 2017, for earlier use of these data near the TDE peak). In this paper, we re-analyse these archival data, as well as data from our own target-of-opportunity Swift observation taken in February 2020, presumably when only the host galaxy was contributing to the optical/UV emission.
The Swift/UVOT photometry was performed by running the UVOTPRODUCT tool with a 5″ aperture centered on the known position of OGLE16aaa and a 20″ sky background region near it. Adjacent measurements were added together until a minimum signal-to-noise ratio (S/N) of 2 was reached, but not allowing observations separated more than 2 days to be co-added.
To obtain the flux densities from the background subtracted and aperture corrected count rates, we used the count rate conversion factors appropriate for a Vega like spectrum (see, Brown et al. 2016, their Table 1). This choice is reasonable, given that OGLE16aaa has a relatively featureless thermal continuum with a temperature of about 23 000 K (Mockler et al. 2019). In order to convert the Vega magnitudes obtained from the UVOTPRODUCT to AB magnitudes, we followed the calibration document SWIFT-UVOT-CALDB-16-R01. We then generated XSPEC compatible pseudo-spectral files and diagonal response matrices for the UVOT filters using the FLX2XSP tool. The UVOT filter central wavelengths and widths were taken from Table 1 of Poole et al. (2008).
The Swift/XRT X-ray light curve was obtained using the XRT generator online tool (Evans et al. 2009). We first generated a light curve binned to time resolution of one observation, which is shown in Fig. 1 using light grey upper limits and error bars when OGLE16aaa was detected. We also generated a stacked images in the 0.3–1.0 keV band from a few adjacent time intervals. For these images, we used the XIMAGE and SOSTA tools centered on OGLE16aaa coordinates to provide a more stringent upper limit or a source detection. The XRT generator was also used to obtain the stacked X-ray spectrum between June 16–21, during which OGLE16aaa was detected in individual observations. A total of 42 X-ray photons were detected in 3379 s of stacked exposure during these three observations. Given the low number of X-ray counts, we grouped the data using GRPPHA to have a minimum of one count per bin and we fitted these data in XSPEC using Cash fit statistics.
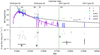 |
Fig. 1. Top panel: optical and UV light curves of OGLE16aaa. Purple and green data points are the OGLE-I and OGLE-V filter photometry (see Wyrzykowski et al. 2017), while cyan, violet, and blue are Swift/UVOT uvw1, uvm2 and uvw2 photometry, respectively (the host galaxy contribution has been subtracted). The TDE plus host galaxy AB magnitudes are shown with grey symbols. The purple line is the best-fitting MOSFit TDE model for a 3 × 10⁶ solar mass black hole (fitted to the I-filter data, following Mockler et al. 2019), and the dashed line shows an arbitrarily scaled γ = −5/3 powerlaw flux decay trend. Bottom panel: X-ray light curve of OGLE16aaa in the 0.3–1 keV band. The grey arrows denote the upper limits as measured by Swift/XRT during observations of ∼1 ks each. The black upper limit comes from stacking 25.7 ks of Swift data. During the winter and spring of 2017, XRT detected the OGLE16aaa only marginally. The two black crosses denote the fluxes measured by XMM-Newton. We note the rapid X-ray flux increase between the June 9 XMM-Newton observation (MJD 57548) and the June 16–21 stacked Swift/XRT observation (MJD 57555–57560). The time periods for extracting the UV/X-ray spectra shown in Figs. 2a–d are shown with green shaded stripes. |
2.3. XMM-Newton observations
XMM-Newton has observed OGLE16aaa twice; on June 9, 2016 for 15 ks (OBSID: 0790181801) and on November 30 2016 for 36.6 ks (OBSID: 0793183201). Both observations were done with the EPIC cameras operating in the full frame mode and using the thin optical blocking filter. The OM observations we performed were carried out using the uvw1 filter and here we utilize the two photometric measurements (AB magnitudes) obtained from the OM pipeline products.
We reduced the EPIC-PN and EPIC-MOS X-ray data using the XMM-SAS version 18.0.0, with the latest calibration files as of January 2020. First, we generated calibrated event lists using the EPPROC and EMPROC tools, utilizing the FLAG == 0 and PATTERN < = 4 event selection criteria. We then eliminated soft proton flaring episodes by generating detector averaged light curves above 10 keV and removing periods when the count rates were above 0.7 and 0.35 for PN and MOS, respectively.
OGLE16aaa is clearly detected in images below 1 keV in both observations. We extracted the light curves and spectra using a circular 20″ source aperture and a 40″ background region from the same EPIC-PN CCD detector. The spectra were extracted with the ESPECGET tool, which generates the source and background spectra, ancillary response files, and redistribution matrices. Finally, the spectra were grouped using GRPPHA to have a minimum of 20 counts per bin. For the longer observation of November 30, 2016, OGLE16aaa was a factor of ten brighter than in June 9, 2016. These EPIC-PN data had sufficient X-ray counts to fit models in XSPEC using χ2 fit statistics. The spectra of PN and MOS detectors matched well in the 0.2–1 keV band and, thus, variable instrument normalizations were not needed in the fits. In the fainter and shorter observation of June 9, 2016, the MOS detectors saw only a few tens of photons each and, thus, only EPIC-PN data were used.
In the following all errors are quoted at the 1-σ level, except for the 3-σ upper limits of the Swift/XRT non-detections.
3. Results
The optical/UV and the X-ray light curves of OGLE16aaa are shown in Fig. 1. Wyrzykowski et al. (2017) was able to pinpoint the first TDE detection to MJD 57369 ± 4 (Dec. 13, 2015). As noted by Jiang et al. (2019), the I-filter light curve has two peaks, with the maximum reached on January 20, 2016 (MJD 57403), giving a TDE rise time of ≈34 days.
Based on the February 9, 2020 Swift/UVOT observations, we measured the following AB magnitudes: 20.93 ± 0.18, 20.43 ± 0.21, 20.30 ± 0.19 mag, for the uvw2, uwm2, and uvw1 filters, respectively. We also clearly detected the host galaxy of OGLE16aaa in the u and b filters and used the color correction terms (from the SWIFT-UVOT-CALDB-03-R02 calibration document) to derive the Johnson B magnitude of B = 18.91 ± 0.14 mag. This magnitude is, in fact, slightly higher than the USNO-B1.0 catalog value of B = 18.38 mag (with a typical uncertainty about 0.3 mag), suggesting that we were indeed measuring only the host galaxy contribution. We therefore subtracted these Feb. 9, 2020 host galaxy magnitudes from all photometry taken in 2016–2017 (and propagated the errors), such that only the TDE contribution is shown for the UV filters in Fig. 1 (similarly to the host-galaxy subtracted OGLE I and V filter data).
The Swift/UVOT magnitudes are consistent with the host galaxy from about MJD 57700 (November 2016) onward, apart from the uvw2 filter data, which is slightly above the host galaxy level. The host galaxy-subtracted Swift/UVOT AB magnitudes of OGLE16aaa are shown in cyan, pink, and blue points in Fig. 1. The non-subtracted photometry is shown with grey points, and we note here that the Swift/UVOT AB magnitudes are higher than in Wyrzykowski et al. (2017) by factors consistent with the Vega-AB magnitude conversion, suggesting that Wyrzykowski et al. (2017) reported the UVOT magnitudes in the Vega system. The optical/UV light curve indicates a flux decay that is roughly consistent with the standard γ = −5/3 trend, particularly in the uvw2 filter. The I-filter brightness evolves slightly more rapidly, having fallen off to a barely detectable level by early June 2016, and it is much better described by the MOSFit TDE models with Mbh = 3.0 × 10⁶ M⊙ (purple line in Fig. 1; see also Mockler et al. 2019). However, around the same time, the Swift/UVOT magnitudes are still significantly higher compared to the host galaxy values.
The X-ray light curve of OGLE16aaa is shown in the bottom panel of Fig. 1. XMM-Newton detected it in both observations (crosses in Fig. 1). On June 9, 2016, the 0.3–1 keV black body flux was about 2.3 × 10⁻¹⁴ erg cm−2 s−1, while on November 30, 2016, the flux was ten times higher at Fbb [0.3 − 1] keV ≈ 2.0 × 10⁻¹³ erg cm−2 s−1 (see Table 1). Swift/XRT, on the other hand, did not detect OGLE16aaa in the first three months: not during individual observations (see the gray upper limits), nor by stacking all the 13 observations, with a 3-σ upper limit of 6.93 × 10⁻⁴ count s−1 (or Fbb [0.3 − 1] keV ≲ 3.18 × 10⁻¹⁴ erg cm−2 s−1, see the black upper limit in Fig. 1). The measured XRT count rates (and upper limits) were converted to 0.3–1 keV fluxes using a conversion factor of 4.589 × 10⁻¹¹, which was derived using the measured 0.3–1 keV count rate and the observed flux in the stacked June 16–21 Swift/XRT spectrum. Interestingly, the first Swift/XRT detection came only a week after the first XMM-Newton observation, with a flux more than ten-fold higher. That is, in just a matter of one week, OGLE16aaa brightened by a factor of more than ten in X-rays, without any hints of a simultaneous brightening in the UV nor optical light curves. This allows us to constrain the date of the X-ray brightening to MJD 57551 ±3, taking place 182 ±5 days after the onset of the optical TDE.
Best-fitting parameters for the June 9 XMM, June 16–21 Swift/XRT, and Nov. 30, 2016 XMM spectra.
The optical/UV/X-ray spectral energy distributions of the spring 2016 Swift/XRT non-detection, the June 9, 2016 XMM-Newton observation, the stacked June 16–21 Swift/XRT observations, and the November 30, 2016 XMM-Newton observation are shown in panels a, b, c, and d of Fig. 2. These four epochs are also highlighted in Fig. 1 with green stripes. The two marginal XRT detections in 2017 are based on five and three X-ray photons, and are, thus, not suitable for spectral analysis. The four X-ray spectra can be adequately fitted with a cool 50–70 eV thermal model in the X-rays, the peak of the emission always below the X-ray band (see Table 1). There is no need to add an absorber apart from the interstellar absorption column of NH, gal = 1.9 × 1020 cm−2. The optical/UV data is also consistent with a thermal component in the Rayleigh-Jeans regime that peaks just above the UV band that is reddened according to the interstellar value of E(B − V) = 0.028 (Schlafly & Finkbeiner 2011).
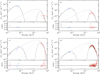 |
Fig. 2. Absorbed dual black body spectral fits of OGLE16aaa during (a) the Spring 2016 optical/UV peak, (b) June 9, 2016 XMM-Newton observation, (c) during the stacked June 16–21 Swift/XRT observation and (d) the November 30, 2016 XMM-Newton observation. The OGLE I and V filter data are shown with purple and green points, the Swift/UVOT uvw1, uvm2, and uvw2 data with cyan, pink, and blue, the XMM-Newton/PN and Swift/XRT data are shown in red, while XMM-Newton/MOS1 and MOS2 are shown in black and brown, respectively. The unabsorbed, and de-reddened black bodies corrected for Milky Way absorption are shown with dotted and dashed lines, while the unabsorbed DISKBB component is shown with a dot-dashed lines. We note the large positive residuals in panel d, indicating a presence of a weak, but significant, high-energy X-ray tail. |
During the spring 2016 optical/UV peak, the black body temperature and radius are Tbb, cold = 14 800 ± 500 K and Rbb, cold = (1.77 ± 0.07) × 1015 cm (assuming a luminosity distance of DL = 819.6 Mpc), although the discrepant I-filter data point makes this (and all other) fits statistically unacceptable. No X-ray emission is detected from OGLE16aaa and we can derive a limit on the ratio between the X-ray emitting hot black body luminosity and the colder, ∼20 000 K optical black body luminosity Lbb, hot/Lbb, cold ≲ 0.20 during the optical peak.
On June 9, 2016 the optical/UV data is consistent with the reported Tbb ≈ 23 000 K (Wyrzykowski et al. 2017; Mockler et al. 2019), and the corresponding emission radius is Rbb = (4.8 ± 0.3) × 1014 cm. The temperature evolution is consistent with the clear difference of UV colors between the early 2016 TDE UV peak compared to June 9, 2016. The X-ray black body component is still weaker than the UV one, the luminosity ratio now being Lbb, hot/Lbb, cold ≈ 0.35. The X-ray spectrum is well described with a Tbb, hot ≈ 50 eV, but it can also be modeled with the DISKBB model (Mitsuda et al. 1984) or with a thermal Bremsstrahlung model with roughly a factor of two higher temperature compared to the black body fits. When extrapolating the best fitting disk or Bremsstrahlung models down to the UV and near infrared (NIR) measurements by Swift/UVOT and OGLE-I, we find that the measured UV and NIR fluxes are factor of about 40 or 10 higher than predicted by the model, respectively. This allows us to exclude the possibility that the entire NIR to X-ray spectrum is generated by a single temperature optically thin Bremsstrahlung component or by a standard multi-color disk during this epoch.
In the stacked June 16–21 Swift/XRT spectrum shown in panel c of Fig. 2, we cannot constrain the temperature well and so we fix it to the value measured by XMM-Newton/PN the week prior. The obtained black body radius corresponds to Rbb ≈ 1.97 × 1012 cm (assuming a luminosity distance of DL = 819.6 Mpc). This is slightly larger than the Schwarzschild radius for a 3 × 10⁶ solar mass black hole of OGLE16aaa (Mockler et al. 2019). The corresponding bolometric luminosity estimate of this X-ray hot thermal component is Lbb, bol = (3.8 ± 0.6) × 1044 erg s−1, which is exactly the Eddington limit for a 3 × 10⁶ solar mass black hole. For the DISKBB model the estimated bolometric luminosity is roughly two times higher. The X-ray black body now dominates the bolometric luminosity, with the ratio being Lbb, hot/Lbb, cold ≈ 8.14.
In the November 30 XMM-Newton observation, the disk model DISKBB fits the X-ray spectrum better than a simple absorbed black body (Δχ2 = 18.6 for the same number of degrees of freedom (DOF)). The best fitting temperatures are consistent with the June 9 XMM-Newton observation, despite the variation by a factor of ten of the observed flux. However, even the DISKBB model leaves an excess near 1 keV, as shown in the bottom panel of Fig. 2d. This excess can be modeled away using a Γ = 1.8 power law (the slope cannot be constrained), which carries about 3% of the 0.3–1 keV flux and becomes the dominant spectral component above 0.8 keV. The ratio between the X-ray and optical black body luminosities had further increased to Lbb, hot/Lbb, cold ≳ 17.4. Curiously, in the November 30 XMM-Newton observation and in the June 16–21 Swift observation, the extrapolated DISKBB component (marked with a dot-dashed lines in Fig. 2) fitted only to the X-ray data matches very well the quasi-simultaneous optical/UV fluxes. It is therefore not obvious if at later times we are seeing two distinct thermally emitting regions. In fact, if we take the best-fitting DISKBB normalization from November 30 and fix the June 16–21 Swift/XRT DISKBB normalization to this value (thus by definition L ∝ T4), we still obtain a good fit to the June 16–21 Swift/XRT data with a temperature of Tin = 71 ± 2 eV and a Cstat = 12.17 for 25 d.o.f. (i.e., ΔCstat = 1.72 compared to the best fitting value shown in Table 1). This demonstrates that with the available data, we cannot reject a scenario where a standard disk forms and reaches the ISCO on June 16th, and cools thereafter according to the L ∝ T4 relation.
The November 30 XMM-Newton observation can be used to derive two useful constraints on the local absorption. On the one hand, if in addition to the interstellar absorption by the Milky Way we add a cold absorber in the vicinity of OGLE16aaa, we can find a 3-σ constraint of NH ≲ 0.7 × 1020 cm−2 from this high S/N XMM-Newton spectrum. On the other hand, we can also check how much additional local absorption would be required to only attribute the differences between the June 9 and the November 30 XMM-Newton observations to changes in local absorption. We thus fixed the X-ray spectral parameters to values obtained from the November 30 XMM-Newton spectrum, and tested three cases with the June 9 XMM-Newton data. First, a neutral fully covering absorber can be ruled out by the data, since we obtain NH ≈ 2.4 × 1021 cm−2 in a very poor fit with χ2 = 77.1 (for 8 d.o.f.). Second, we added a neutral partial covering absorber with TBPCF to the best fitting November 30 XMM-Newton model, which fits the June 9 data much better (χ2 = 8.5 for 7 d.o.f.). We obtained a partial covering fraction of 0.88 ± 0.01, with a column that should be higher than NH ≳ 7.3 × 1021 cm−2. Thirdly, we added the ionized absorber model ZXIPCF and found that for a fully covering column of  cm−2 and an ionization parameter of
  , the data can also be fitted well (χ2 = 7.3 for 7 d.o.f.). Therefore, in order to attribute the X-ray non-detection in Spring 2016 to absorption, a higher column or covering factor, or a lower ionization state than quoted above, would be required.
4. Discussion
The observed late-time X-ray behavior of OGLE16aaa strongly resembles that of the TDEs ASASSN-15oi (Gezari et al. 2017; Holoien et al. 2018) and AT2019azh (Liu et al. 2019; van Velzen et al. 2020). ASASSN-15oi was monitored relatively consistently for the first 100 days since its discovery, after which there was a 100 day gap in the UV and X-ray coverage. Initially the UV flux was factor 100–1000 higher than the X-ray flux. When the regular X-ray and UV monitoring was resumed, the largest changes in the UV versus X-ray flux ratio had already occurred, but there was still a gradual X-ray flux increase for another 100 days or so (see Gezari et al. 2017, their Figs. 3 and 4). Very similarly, in AT2019azh the early coverage lasted about 110 days since discovery and when the UV and X-ray monitoring was resumed about 120 days later, the X-ray flux had increased by more than factor of ten during this long gap.
In the case of OGLE16aaa the X-ray and UV coverage by XMM-Newton and Swift in June was very fortunate, allowing us to pinpoint the X-ray brightening to within a seven-day interval between June 9 and June 16, 2016, taking place 182 ± 5 days from the onset of the optical TDE. The measured delay between the optical versus X-ray brightening is consistent among the three TDEs, but it is only for OGLE16aaa that the X-ray brightening can be determined to be very abrupt. If the X-ray and optical emission is produced by two distinct thermal components, the bolometric luminosity of the hotter X-ray black body was at least a factor of 8–17 times higher than the optical black body luminosity, being roughly comparable to ASASSN-15oi, AT2019azh as well as ASASSN-14li (see Liu et al. 2019; their Fig. 10) after considering that in previous works, the X-ray luminosity was estimated in the 0.3–10 keV band, which only carries about 12–16 per cent of the bolometric flux (see Table 1).
The similarities among the three TDEs are not limited to the light curve morphology. All three TDEs had very similar X-ray black body temperatures of 40–70 eV. Also, in all three of them, the black body temperature remains constant while the X-ray flux increases by more than factor of ten. All three TDEs show signs of a high energy X-ray tail, which in the case of OGLE16aaa is marginally detected and carries only 3% of the 0.3–1 keV flux. Moreover, the phenomenological X-ray spectral analysis of OGLE16aaa optical/UV and X-ray data shows a series of interesting coincidences. After the X-ray brightening event that occurred between June 9 and June 16, the hot thermal component that contributes to the X-rays has a luminosity of Lbb, bol = (3.8 ± 0.6) × 1044 erg s−1, which matches the Eddington value within errors for the 3 × 10⁶ solar mass black hole of OGLE16aaa (Mockler et al. 2019). ASASSN-15oi had a similarly high X-ray luminosity after its brightening event, while in AT2019azh, the luminosity was an order of magnitude lower. When extrapolating the DISKBB component down to the NIR range after the X-ray brightening, the optical/UV spectral energy distribution of OGLE16aaa is fully consistent with a disc spectrum and, furthermore, the corresponding black body radius is of the order of the Schwarzschild radius, just as in ASASSN-15oi. The viscous time scale in the disk is (Pringle 1981) tvisc = R3/2α−1(H/R)−2(GM)−1/2 ≈ 5.4 days (assuming α = 0.1, H/R = 0.1, R = 10Rg = 4.45 × 1012 cm, M = 3 × 10⁶ M⊙) and so the observed X-ray flux increase time scale of less than one week would be compatible to the viscous time scale of the innermost X-ray emitting region of the accretion flow. However, we stress that if both the UV and X-ray emission originates from a standard disk, the X-ray brightening cannot be associated with a global increase in mass accretion rate in the whole disk, otherwise we should have seen a leading UV brightening event prior to the X-ray brightening on June 16th.
From the sparse X-ray data the X-ray flux in OGLE16aaa appears to decay smoothly after the brightening event of June 16–21, 2016 although we cannot exclude that the brightening event was a short lived flare similar to the ones seen in ASASSN-18jd (Neustadt et al. 2020) or AT2019ehz/Gaia19bpt (van Velzen et al. 2020), or – perhaps more exotically – if they are related to X-ray quasi-periodic eruptions recently detected in two super-soft galactic nuclei GSN 069 (Miniutti et al. 2019) and RX J1301.9+2747 (Giustini et al. 2020). In the latter two sources, the thermal component during the flare is significantly hotter, however, namely, it is more in line with the Tbb ∼ 150 eV soft excess component seen in several AGN (Gierliński & Done 2004; Done et al. 2012).
The X-ray temperatures are consistent with respect to their being constant between the two XMM-Newton observations where they can be confidently measured, despite the factor of ten increase in flux. This is not typically expected for a disc that extends to the innermost stable circular orbit (ISCO). In fact, in the June 9 and November 30 XMM-Newton observations, the black body radii are smaller than the ISCO for a non-rotating Schwarzschild black hole. This casts a doubt on the question of whether the X-ray brightening is really due to a sudden increase of the accretion rate at the innermost regions of the accretion disc around the SMBH. However, for accretion disks near or above the Eddington limit, the innermost parts of the flow may not reach thermodynamical equilibrium and can “overheat” due to the low density (Beloborodov 1998). This non-standard inner flow can manifest itself as a variable spectral hardening factor (Davis & El-Abd 2019) that could cause the counter-intuitive thermal evolution we observe.
There are various ways to interpret the late-time X-ray brightening seen in OGLE16aaa. In the Piran et al. (2015) framework (see also Shiokawa et al. 2015; Krolik et al. 2016), the initial optical/UV flare would be generated by shocks during the circularization process of the disrupted star around the SMBH, while the late-time X-ray brightening would arise from a delayed accretion of this circularized gas onto the SMBH. Gezari et al. (2017) and Liu et al. (2019) favored this model for explaining the delayed X-ray emission in ASASSN-15oi and AT2019azh. In the context of this model, OGLE16aaa presents the best case study so far, thanks to the precise measurement of the relevant time scales; the optical TDE onset is known to occur in MJD 57369 ± 4, optical TDE rise time is about 34 days, the X-ray brightening happens during a 7-day interval, and, thus, the X-ray brightening delay from the optical TDE onset is known to be 182 ± 5 days. However, it is not clear why OGLE16aaa as well as ASASSN-15oi and AT2019azh have such long delays between the peak optical and X-ray brightness, when in other “textbook TDEs," such as ASASSN-14li (van Velzen et al. 2016; Holoien et al. 2016; Krolik et al. 2016; Mummery & Balbus 2020) and XMMSL1 J0740-85 (Saxton et al. 2017), the brightening occurs simultaneously. OGLE16aaa has one of the largest inferred black body radii of Rbb ≈ 1.8 × 1015 cm during the optical TDE peak (for comparison, see, van Velzen et al. 2020), which could indicate a larger than usual circularization radius that would, thus, possibly be the cause of the 182-day delay of the Eddington limited accretion onto the SMBH. The fact that at late times, both the optical and X-ray data are consistent with being drawn from only one spectral component lends support to the formation of a standard accretion disc around the SMBH at this time.
Another scenario for the late-time X-ray brightening could be related to variable local absorption. Several TDEs show enhanced X-ray absorption with respect to the expected Galactic absorption column (Auchettl et al. 2017). This excess absorber could be the TDE debris and the recently formed complex accretion flow onto the SMBH or it may just be due to the interstellar gas and dust in the host galaxy. In OGLE16aaa, there are no clear signs of this excess local absorption; all X-ray spectra can be well-fitted with thermal models that have a column fixed to the Galactic value. The absorber could, however, be patchy or ionized and, indeed, we cannot reject a model in which the difference between the two XMM-Newton spectra taken before and after the X-ray brightening is simply attributed to a partial covering or an ionized local absorber covering the X-ray source prior to the brightening. Therefore, the OGLE16aaa data allow us to put constraints to the TDE models which assume that the X-ray emission is re-processed into optical/UV light in a thick torus or a wind or outflow that covers the X-ray-emitting inner accretion flow near the SMBH (e.g., Loeb & Ulmer 1997; Strubbe & Quataert 2009; Metzger & Stone 2016; Lu & Bonnerot 2020). The only viable sequence of events in the context of these models would be that from the TDE onset until the first June 9 XMM-Newton observation, the obscuring material near OGLE16aaa would either need to be ionized and fully covering the source with a column of  cm−2, or neutral and patchy, covering about 90 per cent of the central X-ray source. Then, in just one week, all this obscuring material would need to clear out to produce the X-ray brightening. It is hard to see how the stellar debris could disappear in such a short time. Fast ionized winds that have been seen, for example, from ASASSN-14li (Miller et al. 2015), reaching outflow velocities of up to 0.2 c (Kara et al. 2018), and are much better candidates for the obscuring medium at early times of the TDE. There are also TDEs like XMMSL1 J0740-85 (Saxton et al. 2017), where X-ray spectral changes can be attributed to a variable ionized X-ray absorption and, more generally, occultations of the X-ray source by obscuring clouds are not uncommon in AGN (e.g., Risaliti et al. 2005, 2011; Maiolino et al. 2010; Miniutti et al. 2014). A cloud with a column density of NH ∼ 1022 cm−2 in Keplerian orbit at ∼102 − 103 rg around a SMBH with MBH = 3 × 10⁶ M⊙ could clear out in one week, given a density of a few 106 − 107 cm−3. Such a radial range is consistent with the launching regions of accretion disk winds in AGN (e.g., Proga et al. 2000; Risaliti & Elvis 2010).
Yet another scenario for the late-time X-ray brightening of TDEs was recently proposed by Wen et al. (2020). In their “thinning disk” model, the initial X-ray obscuration would not be due to a wind, but rather caused by a geometrically thick disk obscuring the inner X-ray-emitting accretion flow, which in the cases of OGLE16aaa, ASASSN-15oi, and AT2019azh, would have to be viewed from a large inclination angle. The late-time X-ray brightening would correspond to the thinning of the disk, possibly due to the accretion rate dropping down to the Eddington limit, which allows a direct view onto the X-ray emitting flow. This model would nicely explain why the X-ray luminosity matches the Eddington limit in OGLE16aaa after the brightening and why it is only during the subsequent stages that the optical/X-ray spectral energy distribution is consistent with a thermal disc emission.
5. Summary and conclusions
OGLE16aaa represents the third known example of a late-time X-ray brightening in a TDE. The factor of 20 X-ray brightening occurs in a time span of less than a week without any signs in the simultaneous optical/UV data, causing the X-ray emitting thermal component to be more than 17 times more luminous than the optical one. For the first time we could pin-point the delay between the onset of the optical TDE and the X-ray brightening precisely to 182 ± 5 days. The bolometric luminosity fo the X-ray emitting black body component reached Lbb, bol = (3.8 ± 0.6) × 1044 erg s−1, which matches the Eddington limit for the 3 × 10⁶ solar mass black hole of OGLE16aaa. However, the lack of X-ray temperature evolution is not consistent with the expected behavior for an accretion disk reaching the ISCO.
The delayed X-ray brightening of OGLE16aaa can be interpreted in two ways. The initial optical/UV TDE could be generated by shocks in the circularization of the disrupted star around the SMBH. Then six months later, the majority of this gas finally accretes onto the black hole, thus causing the rapid X-ray brightening. Another scenario that cannot be ruled out is that initially the X-ray emitting inner accretion flow could be hidden behind a modest NH ∼ 1022 cm−2 column of gas that is generated either by a wind or outflow, a geometrically thick disk, or the stellar debris, which then has to rapidly clear out between June 9 and June 16, 2016.
Acknowledgments
We would like to thank the referee for comments that helped to improve the manuscript. JJEK and GM acknowledges support from the Spanish MINECO grant ESP2017-86582-C4-1-R. MG acknowledges support by the “Programa de Atracción de Talento” of the Comunidad de Madrid, grant number 2018-T1/TIC-11733. This research has been partially funded by the AEI Project No. MDM-2017-0737 Unidad de Excelencia “María de Maeztu” – Centro de Astrobiología (INTA-CSIC). We acknowledge the use of public data from the Swift data archive. This work was partly based on observations obtained with XMM-Newton, an ESA science mission with instruments and contributions directly funded by ESA Member States and NASA.
References
- Auchettl, K., Guillochon, J., & Ramirez-Ruiz, E. 2017, ApJ, 838, 149 [Google Scholar]
- Beloborodov, A. M. 1998, MNRAS, 297, 739 [NASA ADS] [CrossRef] [Google Scholar]
- Blanchard, P. K., Nicholl, M., Berger, E., et al. 2017, ApJ, 843, 106 [Google Scholar]
- Bloom, J. S., Giannios, D., Metzger, B. D., et al. 2011, Science, 333, 203 [CrossRef] [PubMed] [Google Scholar]
- Bonnerot, C., Rossi, E. M., & Lodato, G. 2017, MNRAS, 464, 2816 [NASA ADS] [CrossRef] [Google Scholar]
- Brandt, W. N., & Alexander, D. M. 2015, A&ARv, 23, 1 [Google Scholar]
- Brown, P. J., Breeveld, A., Roming, P. W. A., & Siegel, M. 2016, AJ, 152, 102 [NASA ADS] [CrossRef] [Google Scholar]
- Burrows, D. N., Kennea, J. A., Ghisellini, G., et al. 2011, Nature, 476, 421 [NASA ADS] [CrossRef] [PubMed] [Google Scholar]
- Cardelli, J. A., Clayton, G. C., & Mathis, J. S. 1989, ApJ, 345, 245 [NASA ADS] [CrossRef] [Google Scholar]
- Dai, L., McKinney, J. C., Roth, N., Ramirez-Ruiz, E., & Miller, M. C. 2018, ApJ, 859, L20 [Google Scholar]
- Davis, S. W., & El-Abd, S. 2019, ApJ, 874, 23 [NASA ADS] [CrossRef] [Google Scholar]
- Done, C., Davis, S. W., Jin, C., Blaes, O., & Ward, M. 2012, MNRAS, 420, 1848 [NASA ADS] [CrossRef] [Google Scholar]
- Dong, S., Shappee, B. J., Prieto, J. L., et al. 2016, Science, 351, 257 [NASA ADS] [CrossRef] [Google Scholar]
- Esquej, P., Saxton, R. D., Freyberg, M. J., et al. 2007, A&A, 462, L49 [NASA ADS] [CrossRef] [EDP Sciences] [Google Scholar]
- Evans, C. R., & Kochanek, C. S. 1989, ApJ, 346, L13 [NASA ADS] [CrossRef] [Google Scholar]
- Evans, P. A., Beardmore, A. P., Page, K. L., et al. 2009, MNRAS, 397, 1177 [NASA ADS] [CrossRef] [Google Scholar]
- Firth, R., Frohmaier, C., Dimitriadis, G., et al. 2016, ATel., 8559, 1 [NASA ADS] [Google Scholar]
- Gehrels, N., Chincarini, G., Giommi, P., et al. 2004, ApJ, 611, 1005 [NASA ADS] [CrossRef] [Google Scholar]
- Gezari, S., Cenko, S. B., & Arcavi, I. 2017, ApJ, 851, L47 [NASA ADS] [CrossRef] [Google Scholar]
- Gierliński, M., & Done, C. 2004, MNRAS, 349, L7 [NASA ADS] [CrossRef] [Google Scholar]
- Giustini, M., Miniutti, G., & Saxton, R. D. 2020, A&A, 636, L2 [CrossRef] [EDP Sciences] [Google Scholar]
- Guillochon, J., & Ramirez-Ruiz, E. 2013, ApJ, 767, 25 [NASA ADS] [CrossRef] [Google Scholar]
- Guillochon, J., Nicholl, M., Villar, V. A., et al. 2018, ApJS, 236, 6 [NASA ADS] [CrossRef] [Google Scholar]
- Güver, T., & Özel, F. 2009, MNRAS, 400, 2050 [NASA ADS] [CrossRef] [Google Scholar]
- Heckman, T. M., & Best, P. N. 2014, ARA&A, 52, 589 [Google Scholar]
- HI4PI Collaboration (Ben Bekhti, N.) 2016, A&A, 594, A116 [NASA ADS] [CrossRef] [EDP Sciences] [Google Scholar]
- Holoien, T. W. S., Kochanek, C. S., Prieto, J. L., et al. 2016, MNRAS, 455, 2918 [NASA ADS] [CrossRef] [Google Scholar]
- Holoien, T. W. S., Brown, J. S., Auchettl, K., et al. 2018, MNRAS, 480, 5689 [NASA ADS] [CrossRef] [Google Scholar]
- Jiang, N., Wang, T., Yan, L., et al. 2017, ApJ, 850, 63 [Google Scholar]
- Jiang, N., Wang, T., Mou, G., et al. 2019, ApJ, 871, 15 [CrossRef] [Google Scholar]
- Kankare, E., Kotak, R., Mattila, S., et al. 2017, Nat. Astron., 1, 865 [NASA ADS] [CrossRef] [Google Scholar]
- Kara, E., Dai, L., Reynolds, C. S., & Kallman, T. 2018, MNRAS, 474, 3593 [NASA ADS] [CrossRef] [Google Scholar]
- Kormendy, J., & Ho, L. C. 2013, ARA&A, 51, 511 [Google Scholar]
- Krolik, J., Piran, T., Svirski, G., & Cheng, R. M. 2016, ApJ, 827, 127 [NASA ADS] [CrossRef] [Google Scholar]
- Lacy, J. H., Townes, C. H., & Hollenbach, D. J. 1982, ApJ, 262, 120 [NASA ADS] [CrossRef] [Google Scholar]
- Leloudas, G., Fraser, M., Stone, N. C., et al. 2016, Nat. Astron., 1, 0002 [NASA ADS] [CrossRef] [Google Scholar]
- Lin, D., Maksym, P. W., Irwin, J. A., et al. 2015, ApJ, 811, 43 [NASA ADS] [CrossRef] [Google Scholar]
- Liu, X. L., Dou, L. M., Shen, R. F., & Chen, J. H. 2019, ApJ, submitted [arXiv:1912.06081] [Google Scholar]
- Lodato, G., King, A. R., & Pringle, J. E. 2009, MNRAS, 392, 332 [NASA ADS] [CrossRef] [Google Scholar]
- Loeb, A., & Ulmer, A. 1997, ApJ, 489, 573 [NASA ADS] [CrossRef] [Google Scholar]
- Lu, W., & Bonnerot, C. 2020, MNRAS, 492, 686 [NASA ADS] [CrossRef] [Google Scholar]
- Maiolino, R., Risaliti, G., Salvati, M., et al. 2010, A&A, 517, A47 [NASA ADS] [CrossRef] [EDP Sciences] [Google Scholar]
- Metzger, B. D., & Stone, N. C. 2016, MNRAS, 461, 948 [NASA ADS] [CrossRef] [Google Scholar]
- Miller, J. M., Kaastra, J. S., Miller, M. C., et al. 2015, Nature, 526, 542 [NASA ADS] [CrossRef] [Google Scholar]
- Miniutti, G., Sanfrutos, M., Beuchert, T., et al. 2014, MNRAS, 437, 1776 [NASA ADS] [CrossRef] [PubMed] [Google Scholar]
- Miniutti, G., Saxton, R. D., Giustini, M., et al. 2019, Nature, 573, 381 [NASA ADS] [CrossRef] [Google Scholar]
- Mitsuda, K., Inoue, H., Koyama, K., et al. 1984, PASJ, 36, 741 [NASA ADS] [Google Scholar]
- Mockler, B., Guillochon, J., & Ramirez-Ruiz, E. 2019, ApJ, 872, 151 [Google Scholar]
- Mummery, A., & Balbus, S. A. 2020, MNRAS, 492, 5655 [NASA ADS] [CrossRef] [Google Scholar]
- Neustadt, J. M. M., Holoien, T. W. S., Kochanek, C. S., et al. 2020, MNRAS, 494, 2538 [Google Scholar]
- Onori, F., Cannizzaro, G., Jonker, P. G., et al. 2019, MNRAS, 489, 1463 [CrossRef] [Google Scholar]
- Phinney, E. S. 1989, The Center of the Galaxy, ed. M. Morris, IAU Symp., 136, 543 [NASA ADS] [CrossRef] [Google Scholar]
- Piran, T., Svirski, G., Krolik, J., Cheng, R. M., & Shiokawa, H. 2015, ApJ, 806, 164 [NASA ADS] [CrossRef] [Google Scholar]
- Planck Collaboration XIII. 2016, A&A, 594, A13 [NASA ADS] [CrossRef] [EDP Sciences] [Google Scholar]
- Poole, T. S., Breeveld, A. A., Page, M. J., et al. 2008, MNRAS, 383, 627 [Google Scholar]
- Pringle, J. E. 1981, ARA&A, 19, 137 [NASA ADS] [CrossRef] [Google Scholar]
- Proga, D., Stone, J. M., & Kallman, T. R. 2000, ApJ, 543, 686 [NASA ADS] [CrossRef] [Google Scholar]
- Rees, M. J. 1988, Nature, 333, 523 [NASA ADS] [CrossRef] [Google Scholar]
- Rees, M. J. 1990, Science, 247, 817 [NASA ADS] [CrossRef] [Google Scholar]
- Risaliti, G., & Elvis, M. 2010, A&A, 516, A89 [NASA ADS] [CrossRef] [EDP Sciences] [Google Scholar]
- Risaliti, G., Elvis, M., Fabbiano, G., Baldi, A., & Zezas, A. 2005, ApJ, 623, L93 [NASA ADS] [CrossRef] [Google Scholar]
- Risaliti, G., Nardini, E., Salvati, M., et al. 2011, MNRAS, 410, 1027 [NASA ADS] [CrossRef] [Google Scholar]
- Saxton, R. D., Read, A. M., Komossa, S., et al. 2017, A&A, 598, A29 [CrossRef] [EDP Sciences] [Google Scholar]
- Schlafly, E. F., & Finkbeiner, D. P. 2011, ApJ, 737, 103 [NASA ADS] [CrossRef] [Google Scholar]
- Shiokawa, H., Krolik, J. H., Cheng, R. M., Piran, T., & Noble, S. C. 2015, ApJ, 804, 85 [NASA ADS] [CrossRef] [Google Scholar]
- Strubbe, L. E., & Quataert, E. 2009, MNRAS, 400, 2070 [NASA ADS] [CrossRef] [Google Scholar]
- Tchekhovskoy, A., Metzger, B. D., Giannios, D., & Kelley, L. Z. 2014, MNRAS, 437, 2744 [NASA ADS] [CrossRef] [Google Scholar]
- Trakhtenbrot, B., Arcavi, I., MacLeod, C. L., et al. 2019, ApJ, 883, 94 [CrossRef] [Google Scholar]
- van Velzen, S., Anderson, G. E., Stone, N. C., et al. 2016, Science, 351, 62 [NASA ADS] [CrossRef] [Google Scholar]
- van Velzen, S., Gezari, S., Hammerstein, E., et al. 2020, ApJ, submitted [arXiv:2001.01409] [Google Scholar]
- Wen, S., Jonker, P. G., Stone, N. C., Zabludoff, A. I., & Psaltis, D. 2020, ApJ, accepted [arXiv:2003.12583] [Google Scholar]
- Wevers, T., Pasham, D. R., van Velzen, S., et al. 2019, MNRAS, 488, 4816 [Google Scholar]
- Wilms, J., Allen, A., & McCray, R. 2000, ApJ, 542, 914 [NASA ADS] [CrossRef] [Google Scholar]
- Wyrzykowski, Ł., Kostrzewa-Rutkowska, Z., Kozłowski, S., et al. 2014, Acta. Astron., 64, 197 [NASA ADS] [Google Scholar]
- Wyrzykowski, L., Kostrzewa-Rutkowska, Z., Udalski, A., et al. 2016, ATel., 8577, 1 [NASA ADS] [Google Scholar]
- Wyrzykowski, Ł., Zieliński, M., Kostrzewa-Rutkowska, Z., et al. 2017, MNRAS, 465, L114 [NASA ADS] [CrossRef] [Google Scholar]
- Yang, C.-W., Wang, T.-G., Ferland, G., et al. 2013, ApJ, 774, 46 [CrossRef] [Google Scholar]
All Tables
Best-fitting parameters for the June 9 XMM, June 16–21 Swift/XRT, and Nov. 30, 2016 XMM spectra.
All Figures
|
Fig. 1. Top panel: optical and UV light curves of OGLE16aaa. Purple and green data points are the OGLE-I and OGLE-V filter photometry (see Wyrzykowski et al. 2017), while cyan, violet, and blue are Swift/UVOT uvw1, uvm2 and uvw2 photometry, respectively (the host galaxy contribution has been subtracted). The TDE plus host galaxy AB magnitudes are shown with grey symbols. The purple line is the best-fitting MOSFit TDE model for a 3 × 10⁶ solar mass black hole (fitted to the I-filter data, following Mockler et al. 2019), and the dashed line shows an arbitrarily scaled γ = −5/3 powerlaw flux decay trend. Bottom panel: X-ray light curve of OGLE16aaa in the 0.3–1 keV band. The grey arrows denote the upper limits as measured by Swift/XRT during observations of ∼1 ks each. The black upper limit comes from stacking 25.7 ks of Swift data. During the winter and spring of 2017, XRT detected the OGLE16aaa only marginally. The two black crosses denote the fluxes measured by XMM-Newton. We note the rapid X-ray flux increase between the June 9 XMM-Newton observation (MJD 57548) and the June 16–21 stacked Swift/XRT observation (MJD 57555–57560). The time periods for extracting the UV/X-ray spectra shown in Figs. 2a–d are shown with green shaded stripes. |
| In the text | |
|
Fig. 2. Absorbed dual black body spectral fits of OGLE16aaa during (a) the Spring 2016 optical/UV peak, (b) June 9, 2016 XMM-Newton observation, (c) during the stacked June 16–21 Swift/XRT observation and (d) the November 30, 2016 XMM-Newton observation. The OGLE I and V filter data are shown with purple and green points, the Swift/UVOT uvw1, uvm2, and uvw2 data with cyan, pink, and blue, the XMM-Newton/PN and Swift/XRT data are shown in red, while XMM-Newton/MOS1 and MOS2 are shown in black and brown, respectively. The unabsorbed, and de-reddened black bodies corrected for Milky Way absorption are shown with dotted and dashed lines, while the unabsorbed DISKBB component is shown with a dot-dashed lines. We note the large positive residuals in panel d, indicating a presence of a weak, but significant, high-energy X-ray tail. |
| In the text | |
Current usage metrics show cumulative count of Article Views (full-text article views including HTML views, PDF and ePub downloads, according to the available data) and Abstracts Views on Vision4Press platform.
Data correspond to usage on the plateform after 2015. The current usage metrics is available 48-96 hours after online publication and is updated daily on week days.
Initial download of the metrics may take a while.