Fig. 1.
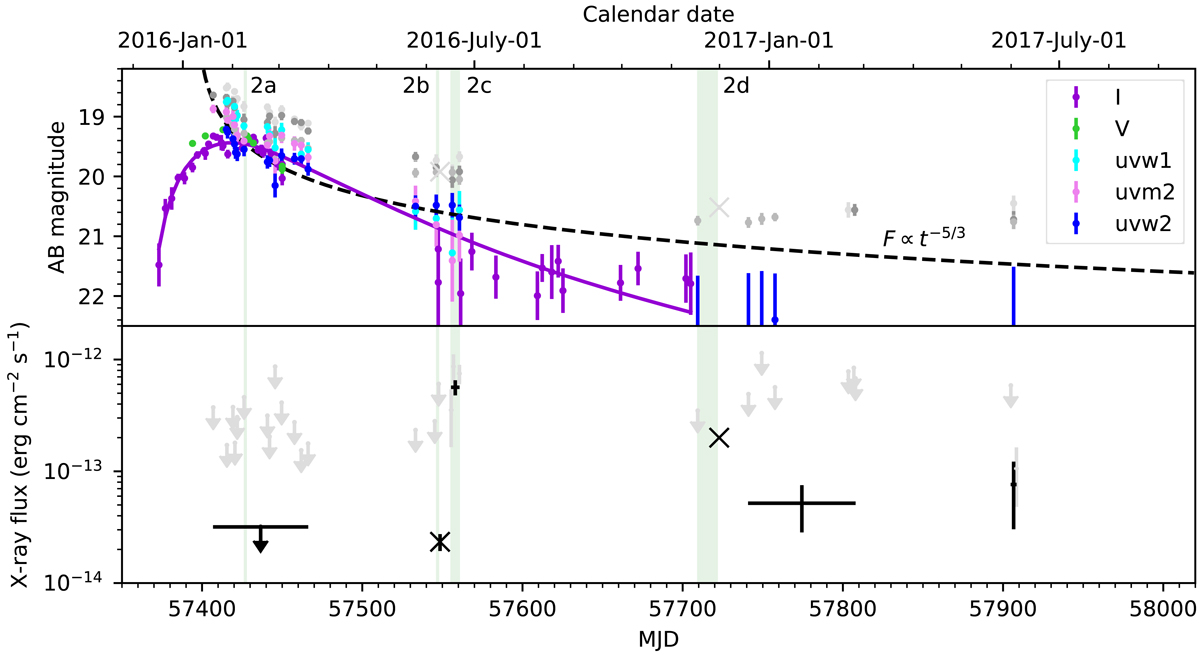
Top panel: optical and UV light curves of OGLE16aaa. Purple and green data points are the OGLE-I and OGLE-V filter photometry (see Wyrzykowski et al. 2017), while cyan, violet, and blue are Swift/UVOT uvw1, uvm2 and uvw2 photometry, respectively (the host galaxy contribution has been subtracted). The TDE plus host galaxy AB magnitudes are shown with grey symbols. The purple line is the best-fitting MOSFit TDE model for a 3 × 10⁶ solar mass black hole (fitted to the I-filter data, following Mockler et al. 2019), and the dashed line shows an arbitrarily scaled γ = −5/3 powerlaw flux decay trend. Bottom panel: X-ray light curve of OGLE16aaa in the 0.3–1 keV band. The grey arrows denote the upper limits as measured by Swift/XRT during observations of ∼1 ks each. The black upper limit comes from stacking 25.7 ks of Swift data. During the winter and spring of 2017, XRT detected the OGLE16aaa only marginally. The two black crosses denote the fluxes measured by XMM-Newton. We note the rapid X-ray flux increase between the June 9 XMM-Newton observation (MJD 57548) and the June 16–21 stacked Swift/XRT observation (MJD 57555–57560). The time periods for extracting the UV/X-ray spectra shown in Figs. 2a–d are shown with green shaded stripes.
Current usage metrics show cumulative count of Article Views (full-text article views including HTML views, PDF and ePub downloads, according to the available data) and Abstracts Views on Vision4Press platform.
Data correspond to usage on the plateform after 2015. The current usage metrics is available 48-96 hours after online publication and is updated daily on week days.
Initial download of the metrics may take a while.