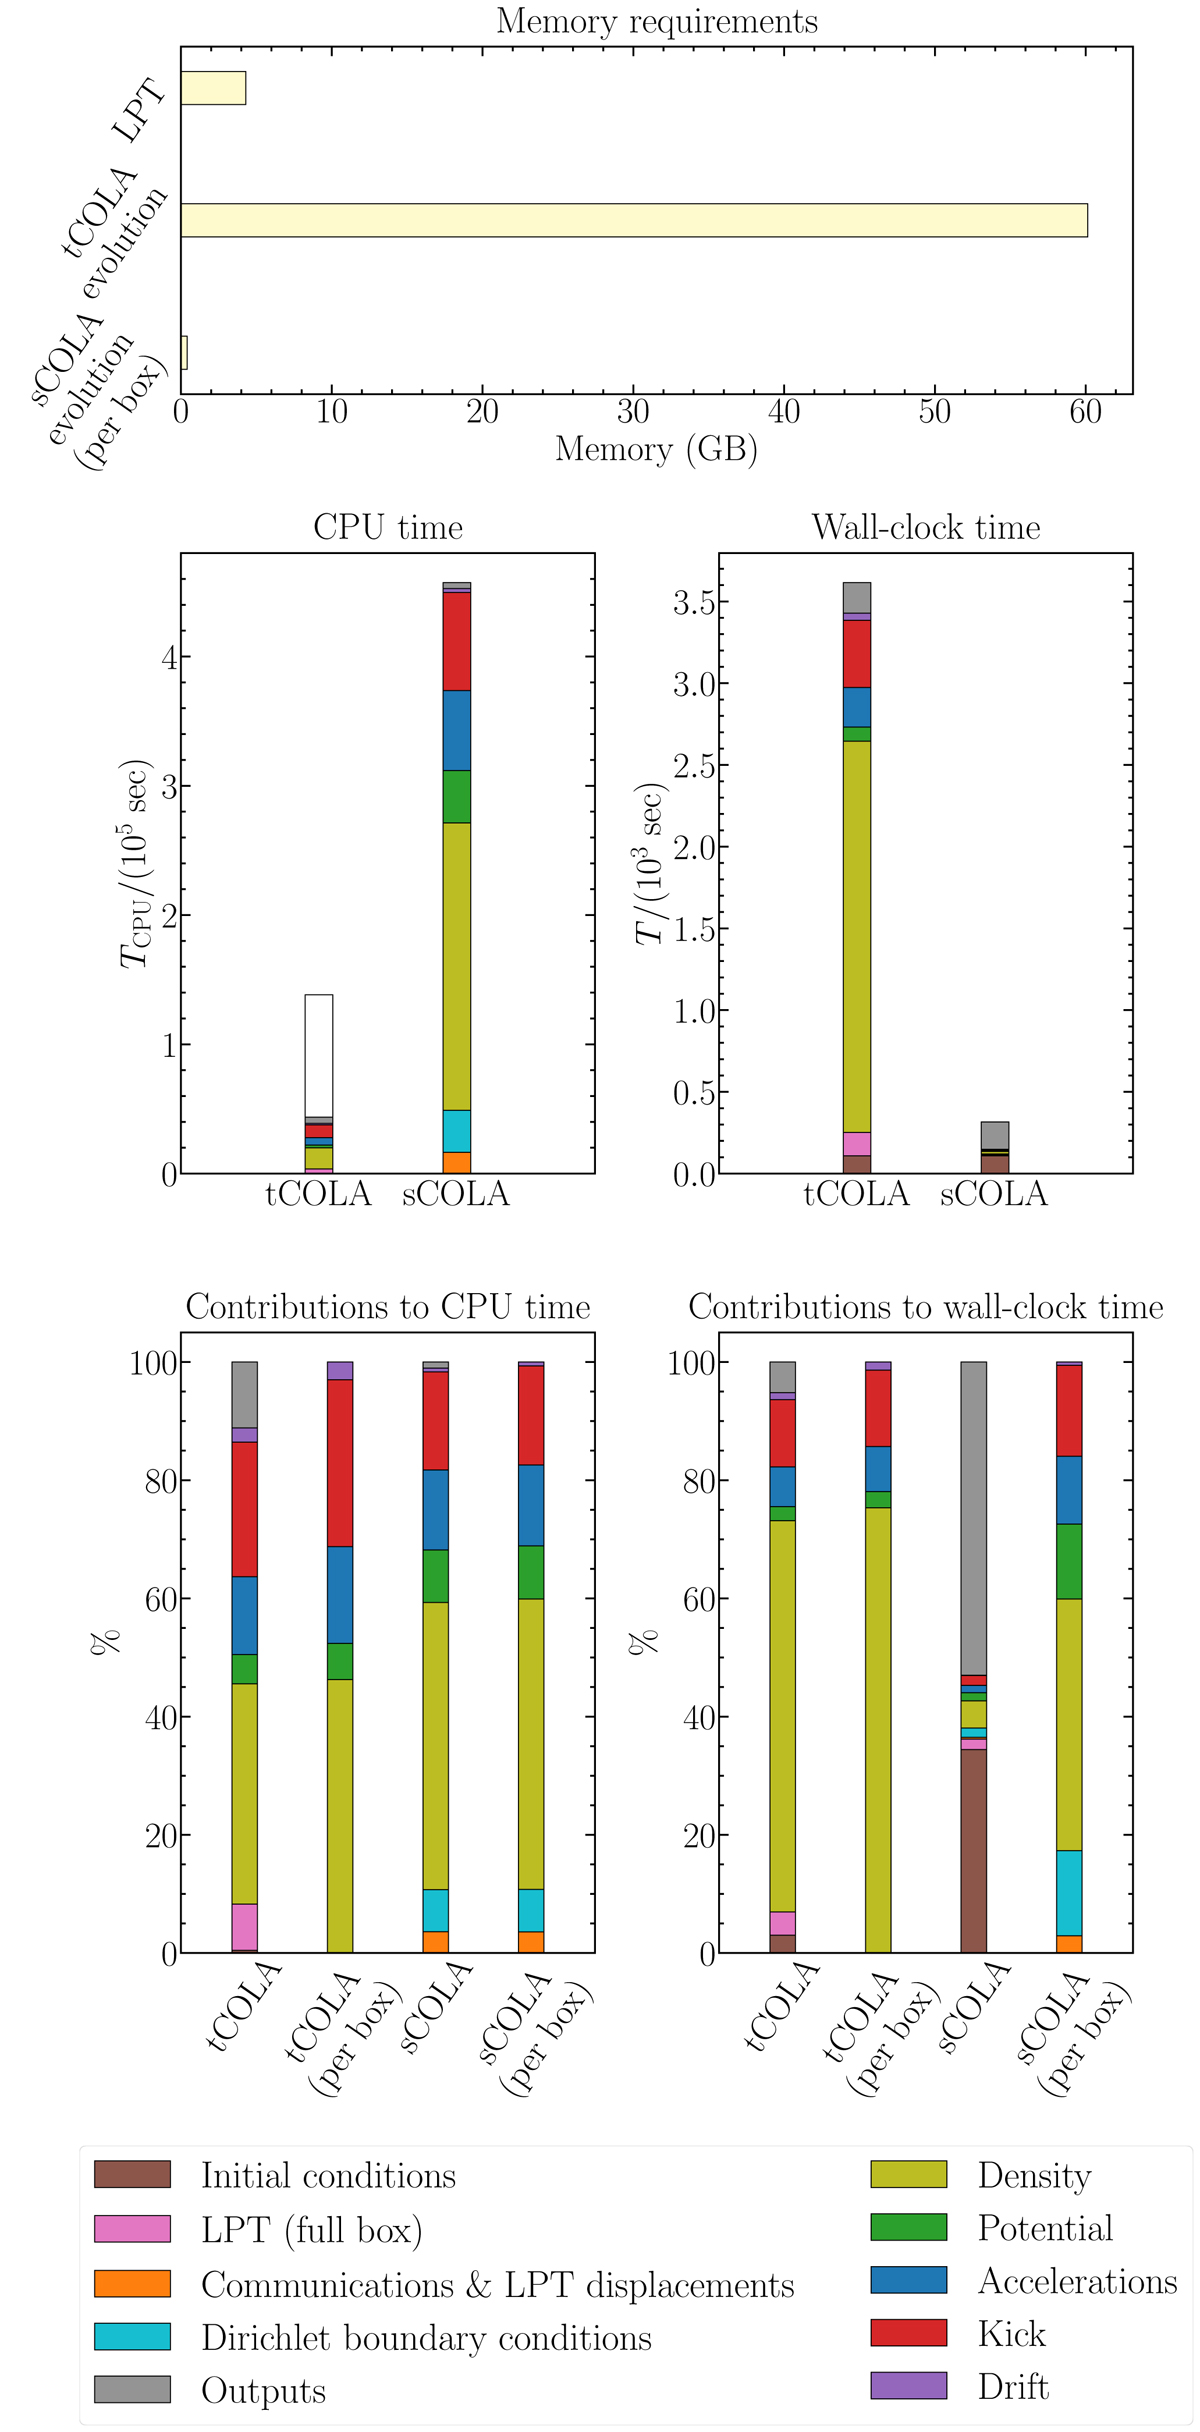
Fig. 8.

Memory requirements (first row) and timings for two corresponding tCOLA and sCOLA simulations. Although the CPU time required is higher for sCOLA, the memory consumption and wall-clock time are significantly reduced with respect to tCOLA, due to the perfectly parallel nature of most computations (second row). In the middle left panel, the height of the white bar shows the hypothetical cost of running tCOLA for the same volume as simulated with sCOLA, when taking buffer regions into account. The relative contributions of different operations, as detailed in the legend, is shown in the third row. The main difference in computational cost in sCOLA with respect to tCOLA comes from the use of DSTs instead of FFTs, which makes the evaluation of the potential significantly more expensive.
Current usage metrics show cumulative count of Article Views (full-text article views including HTML views, PDF and ePub downloads, according to the available data) and Abstracts Views on Vision4Press platform.
Data correspond to usage on the plateform after 2015. The current usage metrics is available 48-96 hours after online publication and is updated daily on week days.
Initial download of the metrics may take a while.


