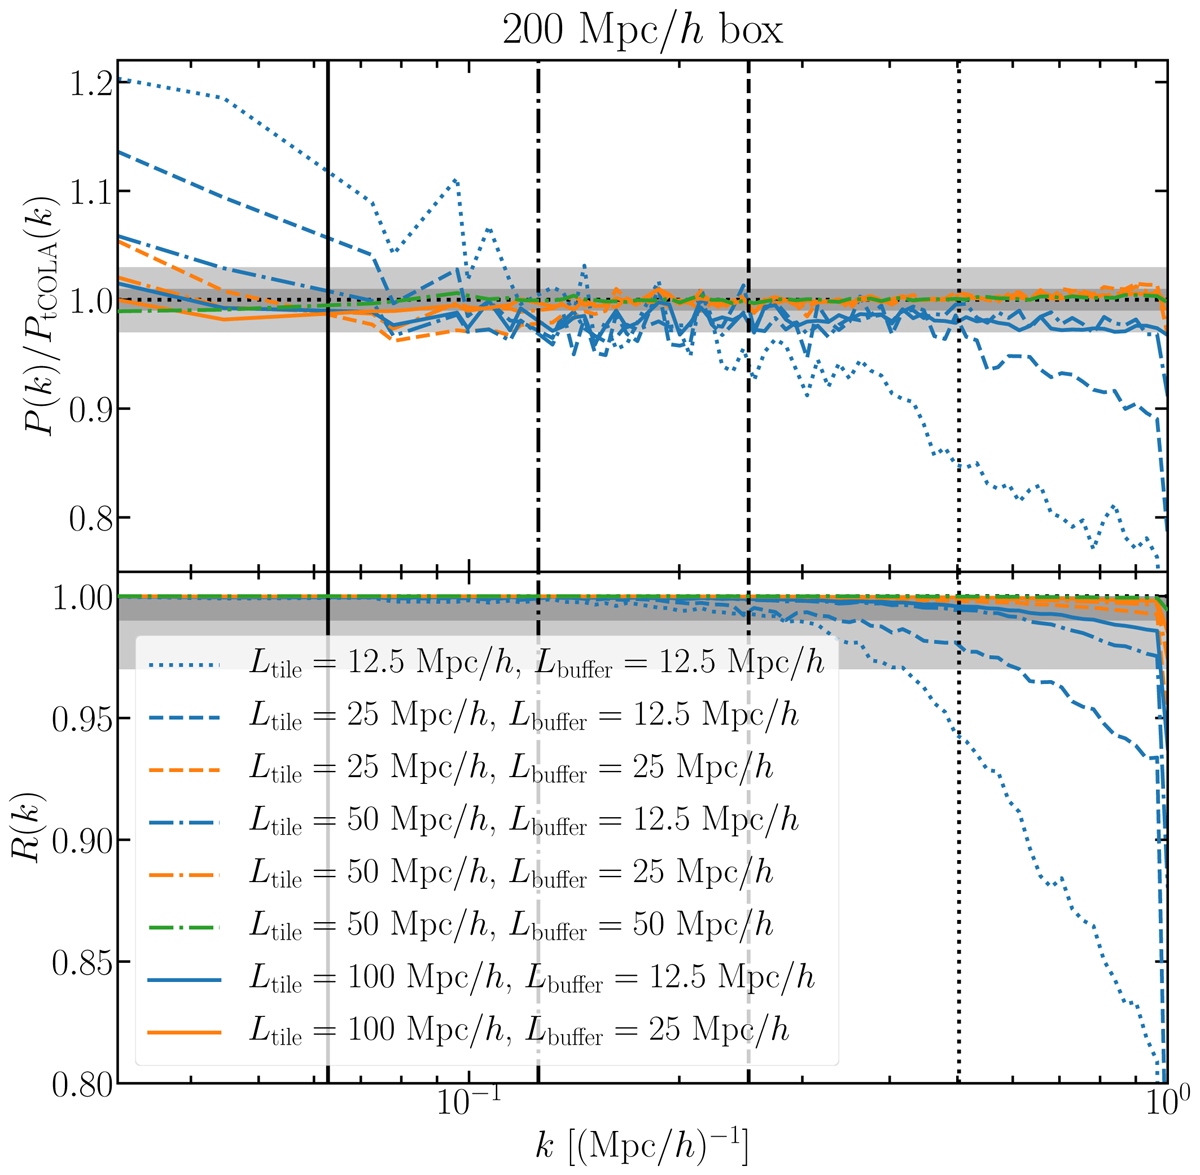
Fig. 5.

Power spectrum relative to tCOLA (top panel) and cross-correlation with respect to tCOLA (bottom panel) of redshift-zero sCOLA density fields, in a 200 Mpc h−1 box containing 5123 dark matter particles. Different sizes for the tiles (represented by different line styles) and buffer regions (represented by different colours) are used, as indicated in the legend. The vertical lines show the respective fundamental mode of different tiles, the light grey bands correspond to 3% accuracy, and the dark grey bands to 1% accuracy.
Current usage metrics show cumulative count of Article Views (full-text article views including HTML views, PDF and ePub downloads, according to the available data) and Abstracts Views on Vision4Press platform.
Data correspond to usage on the plateform after 2015. The current usage metrics is available 48-96 hours after online publication and is updated daily on week days.
Initial download of the metrics may take a while.


