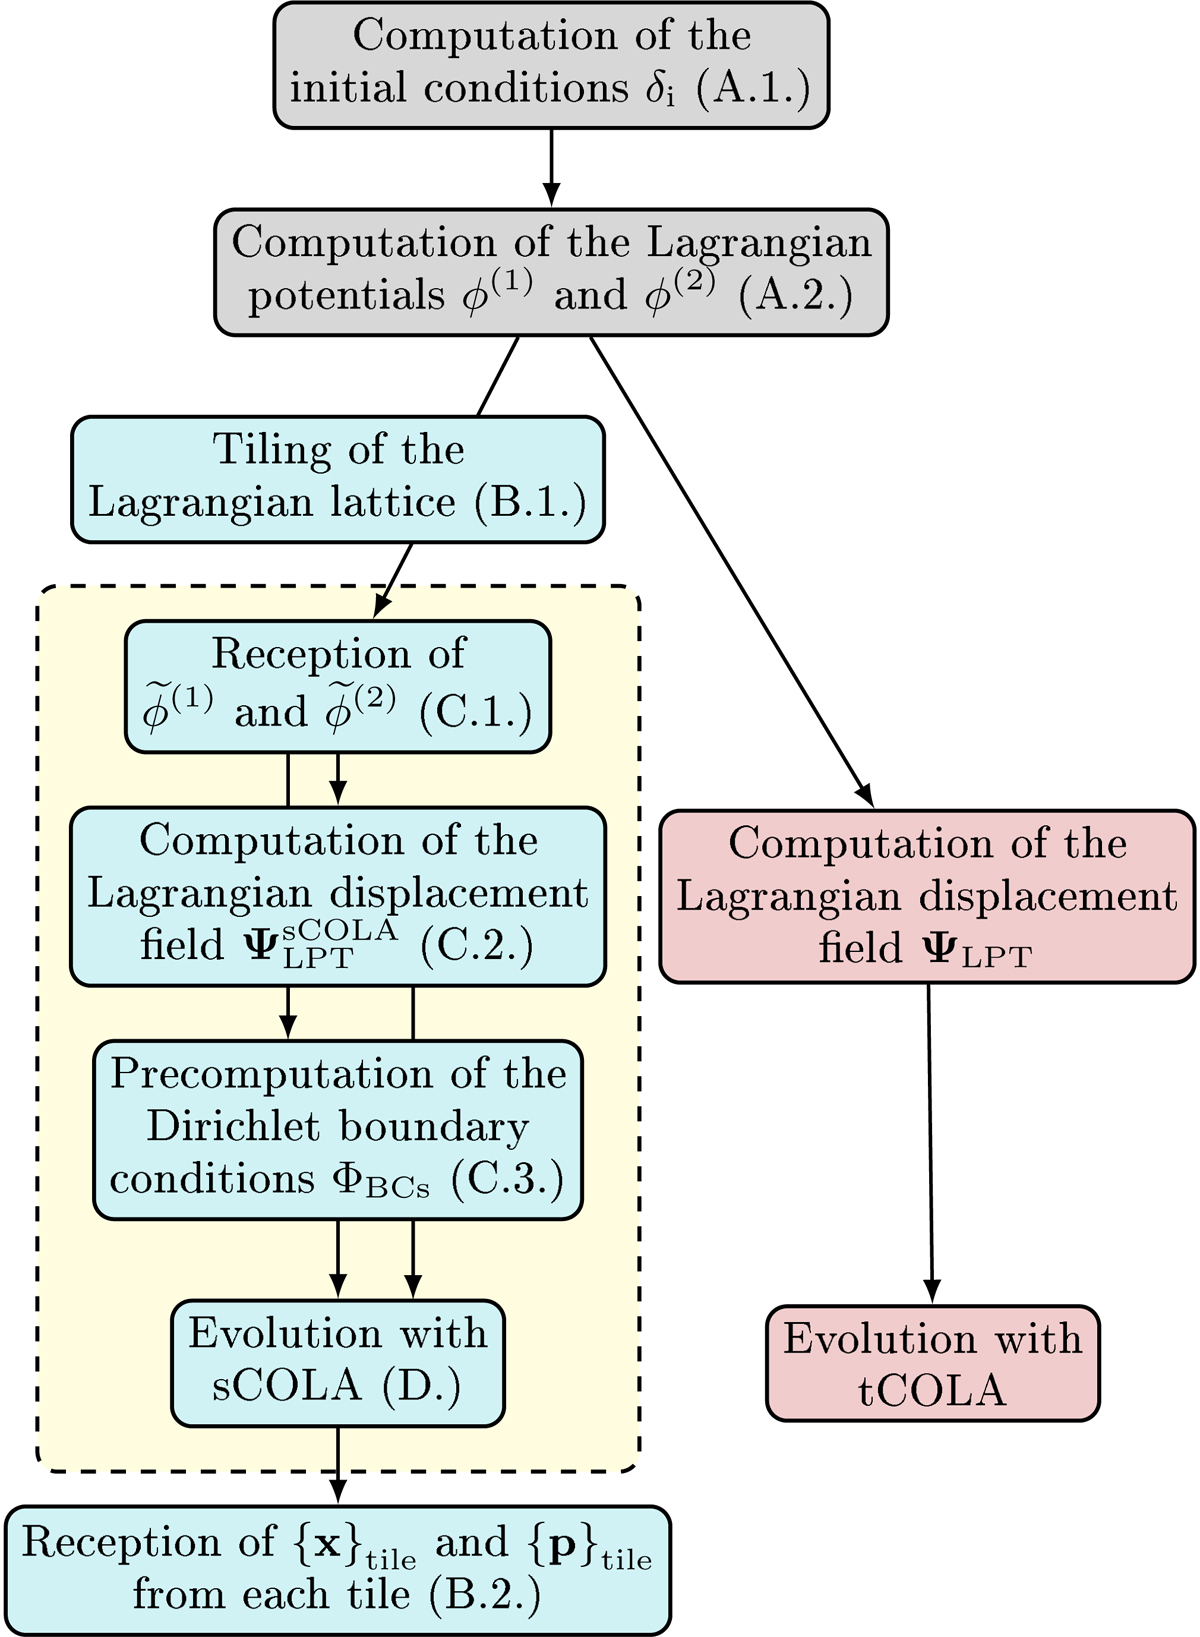
Fig. 1.

Functional diagram of sCOLA (left) versus tCOLA (right). The grey boxes are common steps. sCOLA specific steps are represented in blue, and tCOLA specific steps in red. The yellow rectangle constitutes the perfectly parallel section, within which no communication is required with the master process or between processes. Arrows represent dependencies, and references to the main text are given between parentheses.
Current usage metrics show cumulative count of Article Views (full-text article views including HTML views, PDF and ePub downloads, according to the available data) and Abstracts Views on Vision4Press platform.
Data correspond to usage on the plateform after 2015. The current usage metrics is available 48-96 hours after online publication and is updated daily on week days.
Initial download of the metrics may take a while.


