Free Access
Fig. 8
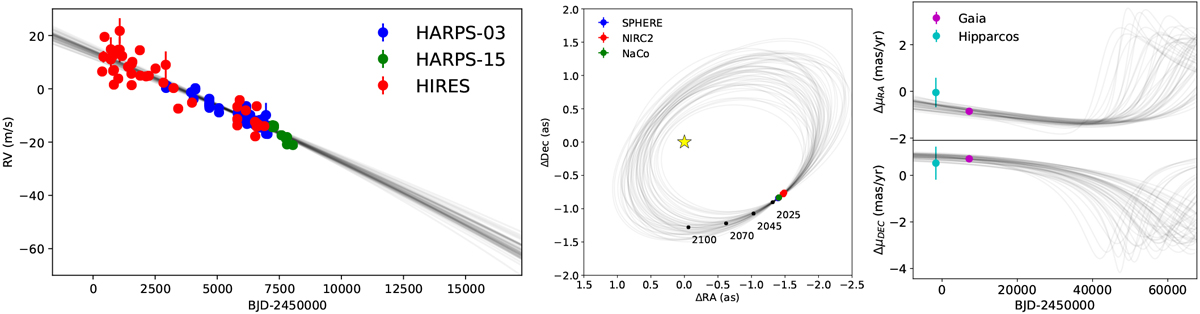
Sample of 50 model orbits (gray curves) fitted on the HD 19467B data (colored points) from RV (left), imaging (middle), and astrometry (right). In the middle panel, the yellow star marks the location of the star and the black dots show the median predicted position for a few epochs in the future.
Current usage metrics show cumulative count of Article Views (full-text article views including HTML views, PDF and ePub downloads, according to the available data) and Abstracts Views on Vision4Press platform.
Data correspond to usage on the plateform after 2015. The current usage metrics is available 48-96 hours after online publication and is updated daily on week days.
Initial download of the metrics may take a while.