Fig. 7

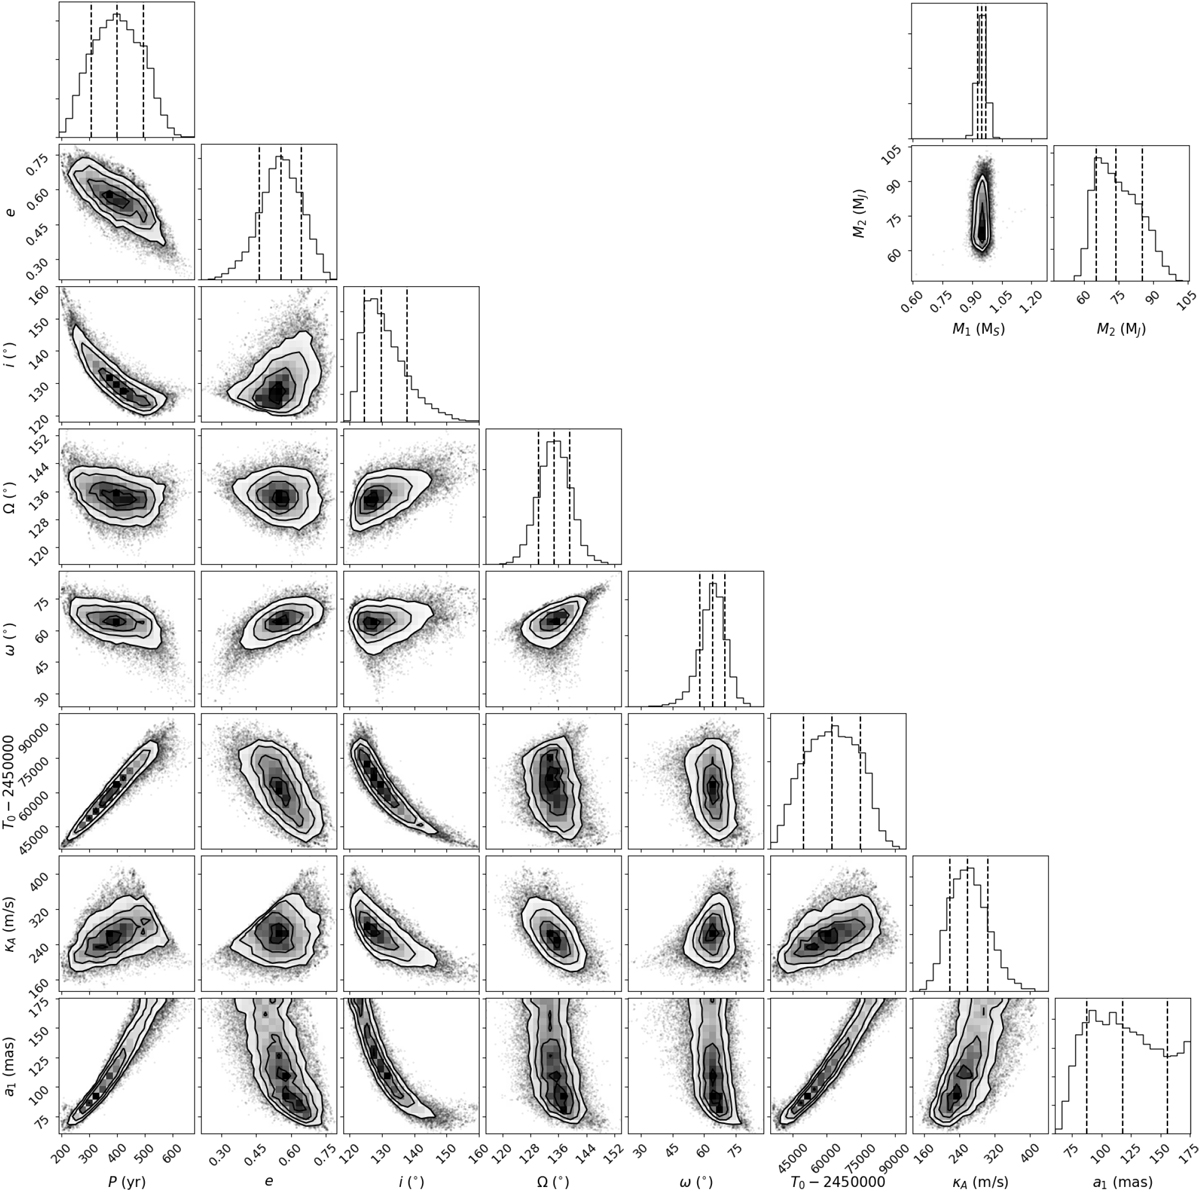
MCMC samples from the posteriors of the orbital parameters (left) and of the masses of HD 19467 A and B (top right) obtained by fitting the imaging, RV, and astrometric data. The diagrams displayed on the diagonal from top left to lower right represent the 1D histogram distributions for the individual elements. The off-diagonal diagrams show the correlations between pairs of orbital elements. In the histograms, the dashed vertical lines indicate the 16, 50, and 84% quantiles.
Current usage metrics show cumulative count of Article Views (full-text article views including HTML views, PDF and ePub downloads, according to the available data) and Abstracts Views on Vision4Press platform.
Data correspond to usage on the plateform after 2015. The current usage metrics is available 48-96 hours after online publication and is updated daily on week days.
Initial download of the metrics may take a while.


