Fig. 11
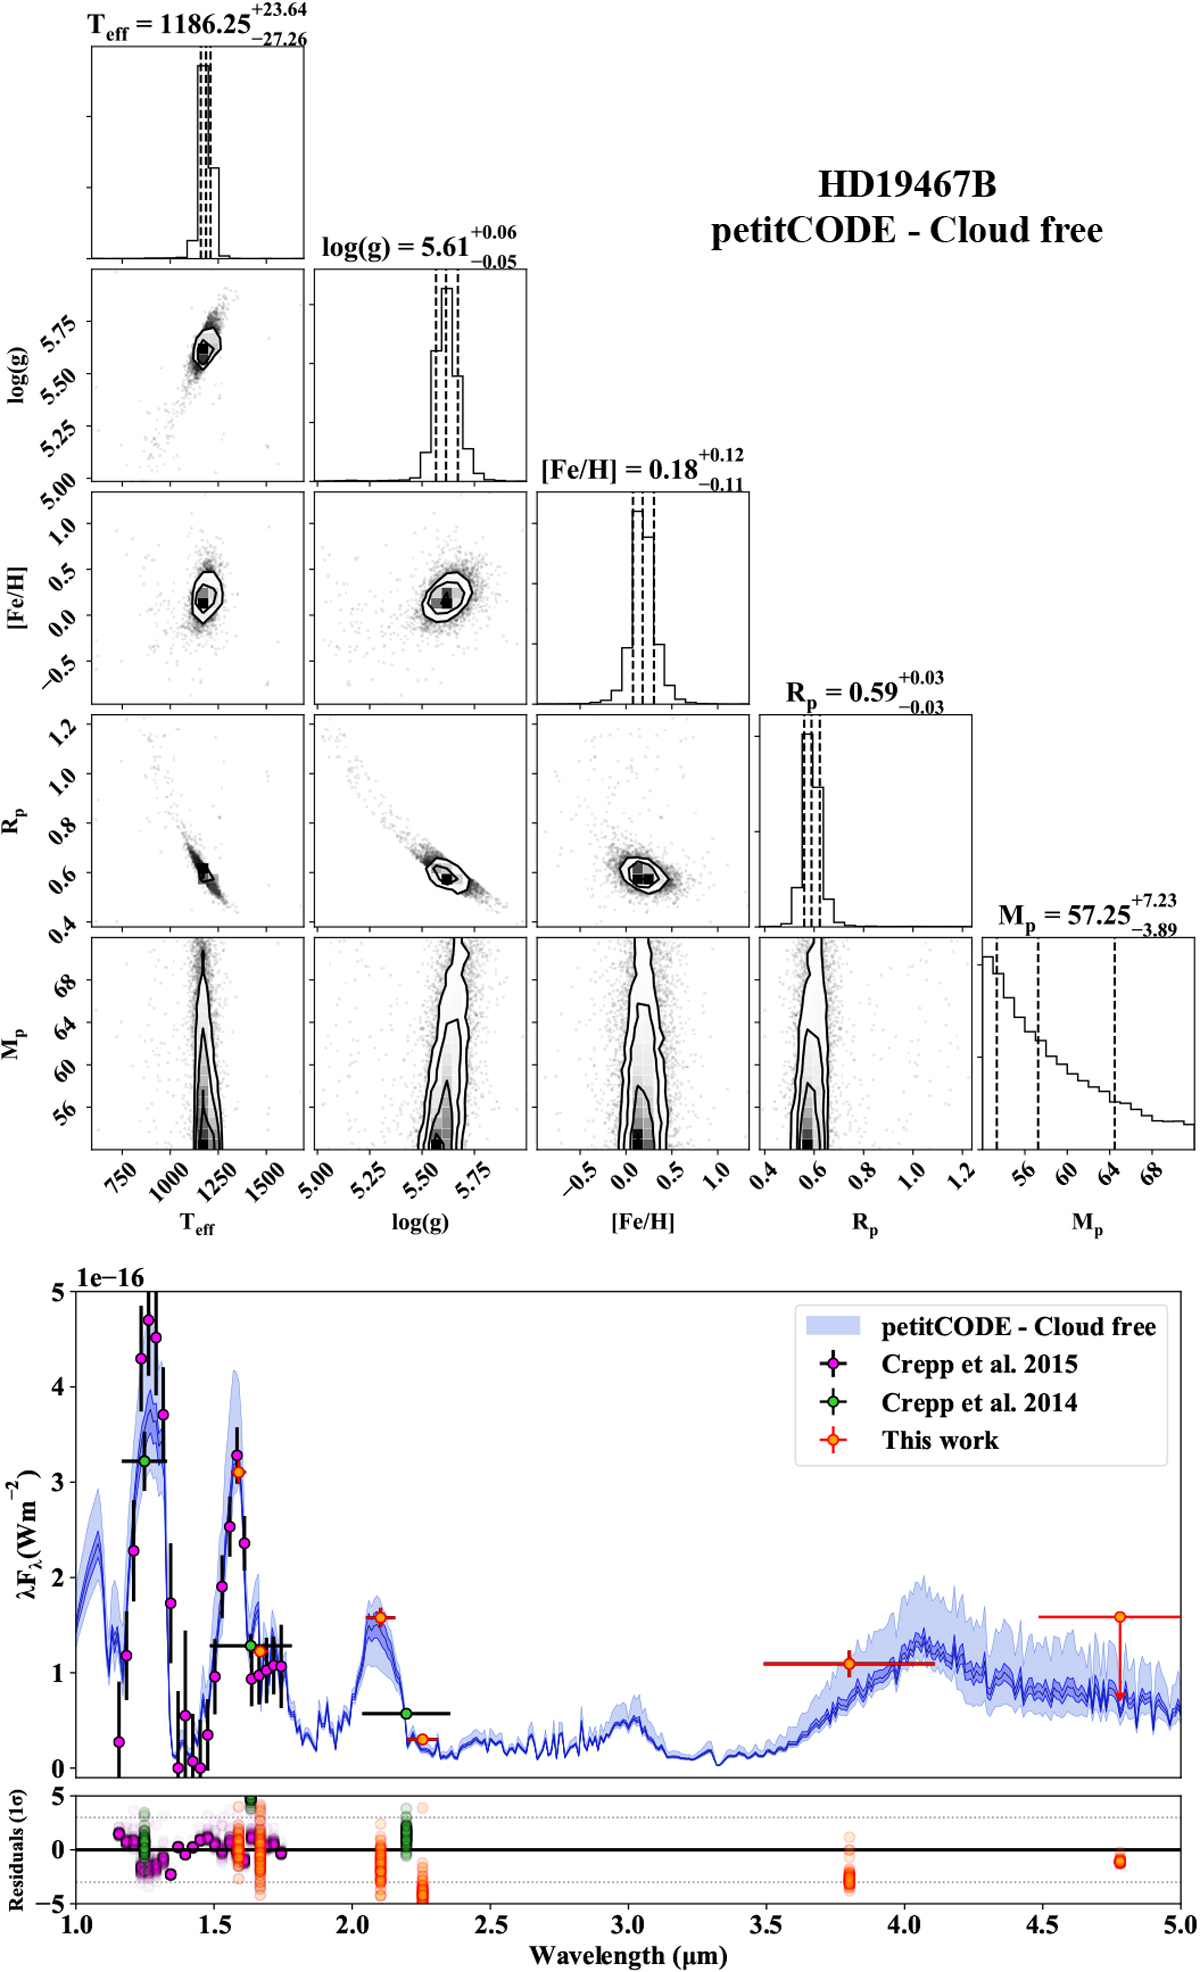
Atmospheric fitting of HD 19467B with petitCODE cloud-free models. Top panel: corner plot of the retrieved atmospheric parameters. Bottom panel: comparison of the best-fit model spectra and of the measured SED (colored data points). For the model spectra, the dark blue area corresponds to the region of the posteriors between the 16 and 84% quantiles and the light blue area to the region between the 1 and 99% quantiles.
Current usage metrics show cumulative count of Article Views (full-text article views including HTML views, PDF and ePub downloads, according to the available data) and Abstracts Views on Vision4Press platform.
Data correspond to usage on the plateform after 2015. The current usage metrics is available 48-96 hours after online publication and is updated daily on week days.
Initial download of the metrics may take a while.