Fig. 10
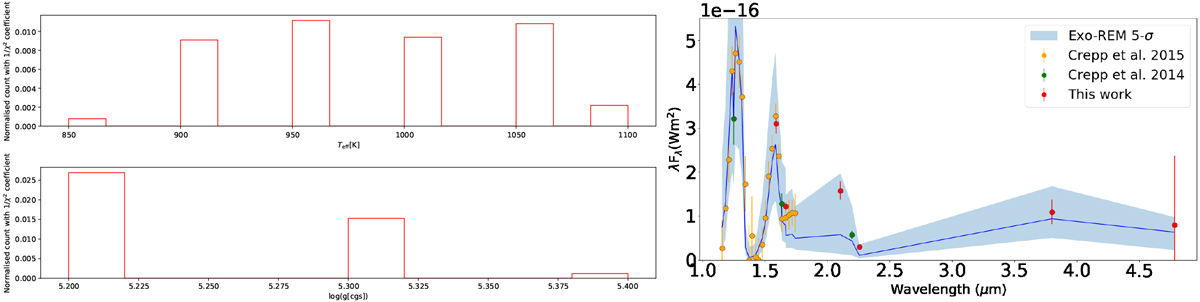
Left: histograms of the effective temperature (top) and surface gravity (bottom) of the models from Exo-REM, reproducing the data, without cloud covering all metallicity values (see text). The number of count is normalized using the invert of the χ2. Right: comparison of the best-fit model spectra (dark blue line: best fit, light blue area: 5σ envelope) and of the mesured SED (colored data points).
Current usage metrics show cumulative count of Article Views (full-text article views including HTML views, PDF and ePub downloads, according to the available data) and Abstracts Views on Vision4Press platform.
Data correspond to usage on the plateform after 2015. The current usage metrics is available 48-96 hours after online publication and is updated daily on week days.
Initial download of the metrics may take a while.