Fig. 8.
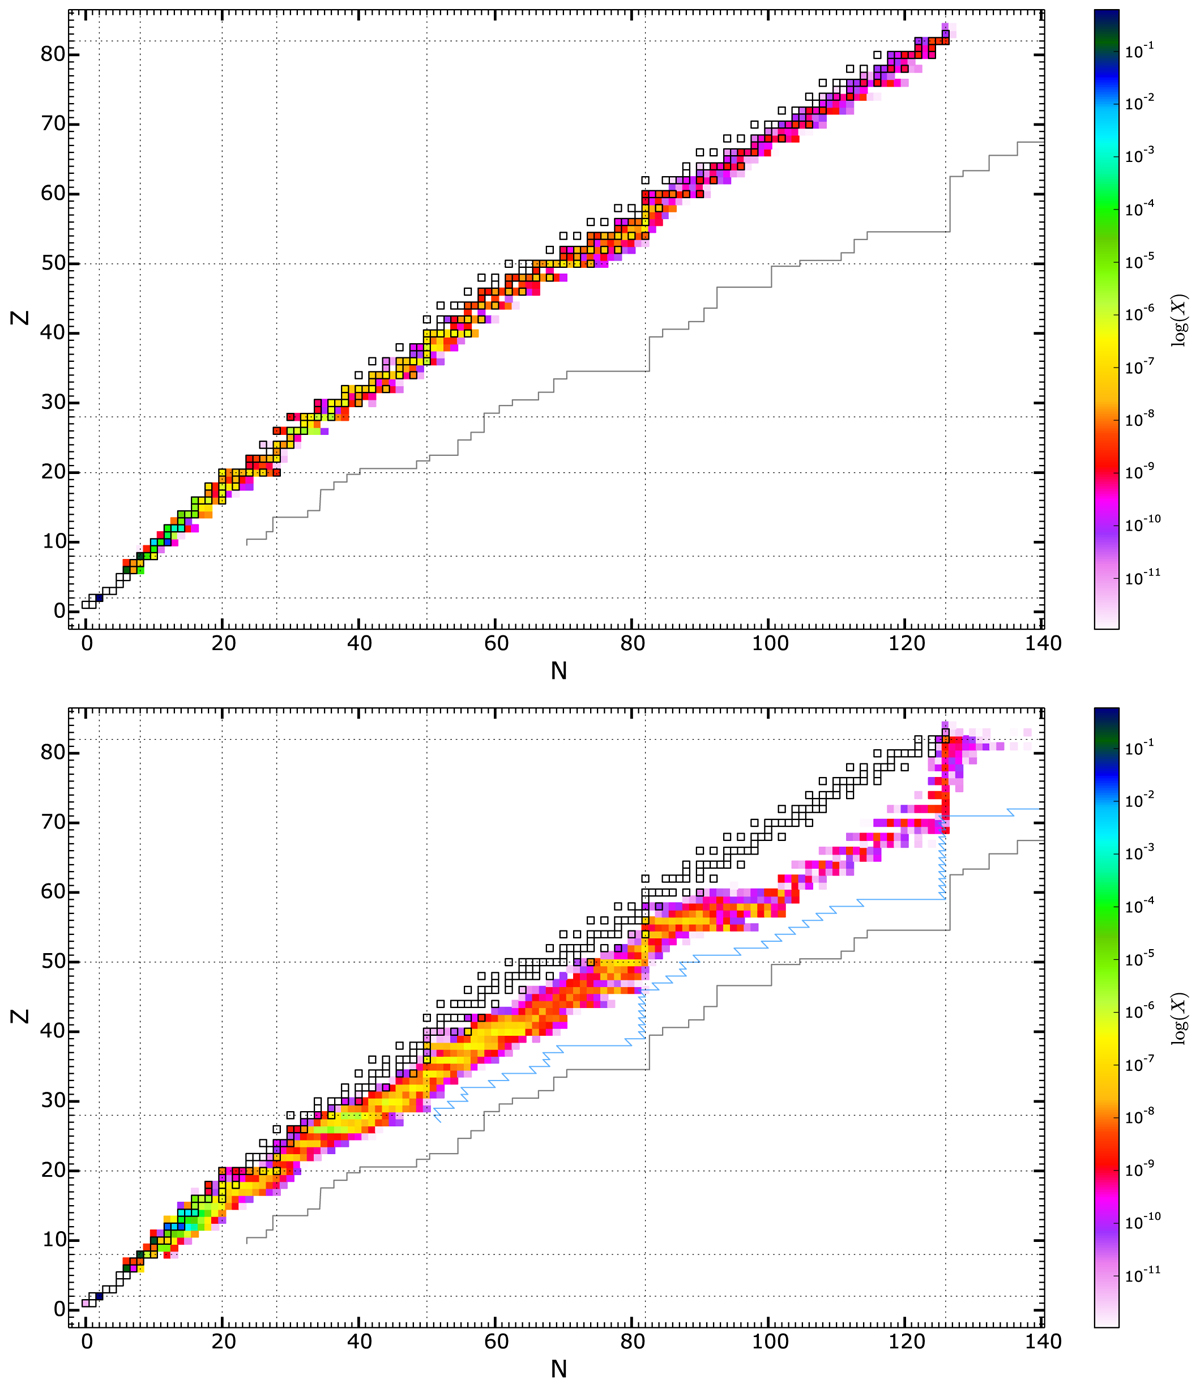
Pre-jet mass fractions (top panel) and post-jet mass fractions (before beta decays, bottom panel) for a mass particle at Mr, ini = 16.53 M⊙ and θini = 3.15° (same mass particle as in Fig. 4). Black squares denote stable isotopes. The light blue line shows a typical r-process flow for comparison purposes (taken from Arnould & Goriely 2020, their Fig. 5). The grey line shows the neutron drip line. Thin dotted lines show the location of the magic numbers.
Current usage metrics show cumulative count of Article Views (full-text article views including HTML views, PDF and ePub downloads, according to the available data) and Abstracts Views on Vision4Press platform.
Data correspond to usage on the plateform after 2015. The current usage metrics is available 48-96 hours after online publication and is updated daily on week days.
Initial download of the metrics may take a while.