Fig. 7.
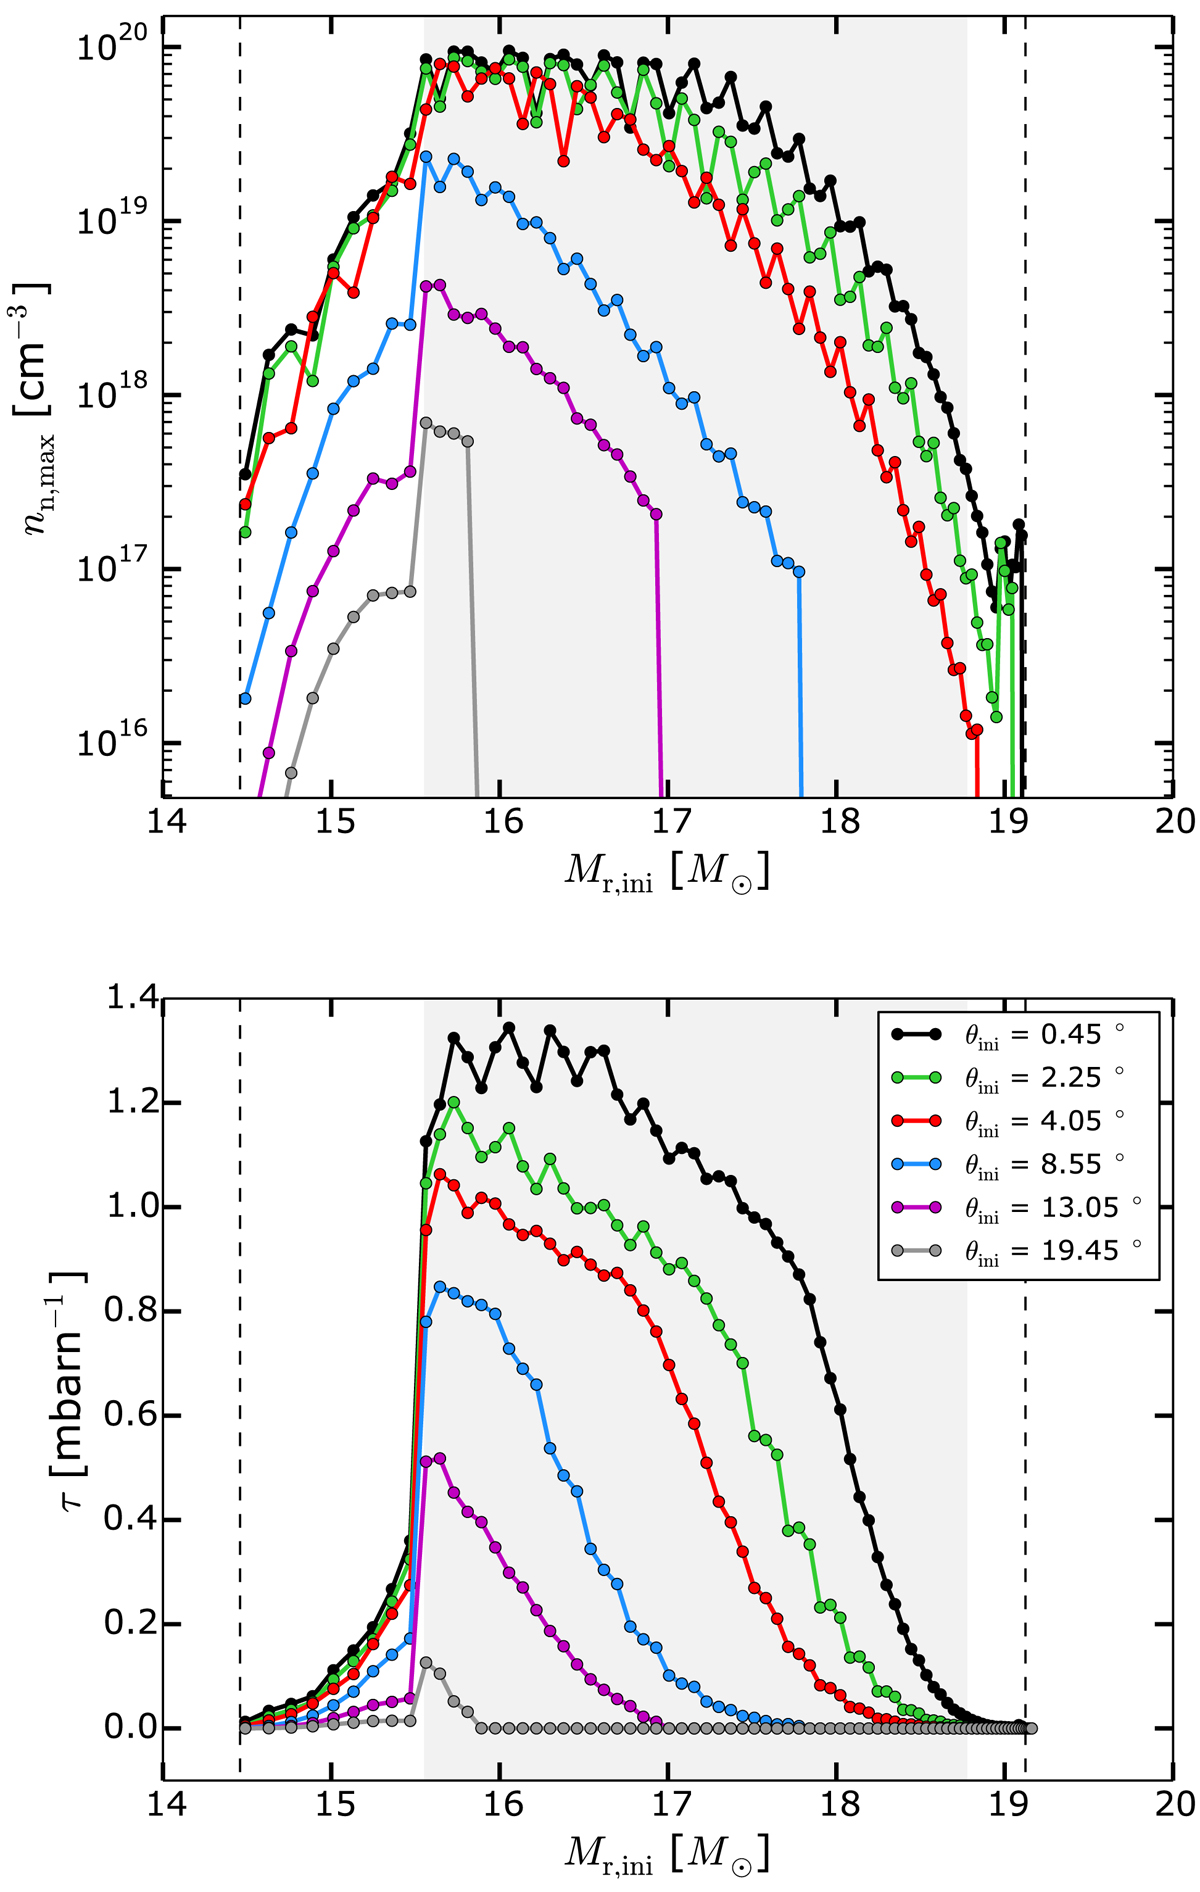
Maximum neutron density (top) and neutron exposure (bottom) during the jet explosion as a function of the initial mass coordinate. Coloured lines show different initial angles. Each point represents a mass particle with initial coordinates θini and Mr, ini. The two dashed lines show the initial location of the bottom of helium and hydrogen shells. The shaded areas show the convective zone at the pre-jet stage (see also Fig. 1).
Current usage metrics show cumulative count of Article Views (full-text article views including HTML views, PDF and ePub downloads, according to the available data) and Abstracts Views on Vision4Press platform.
Data correspond to usage on the plateform after 2015. The current usage metrics is available 48-96 hours after online publication and is updated daily on week days.
Initial download of the metrics may take a while.