Fig. 4.
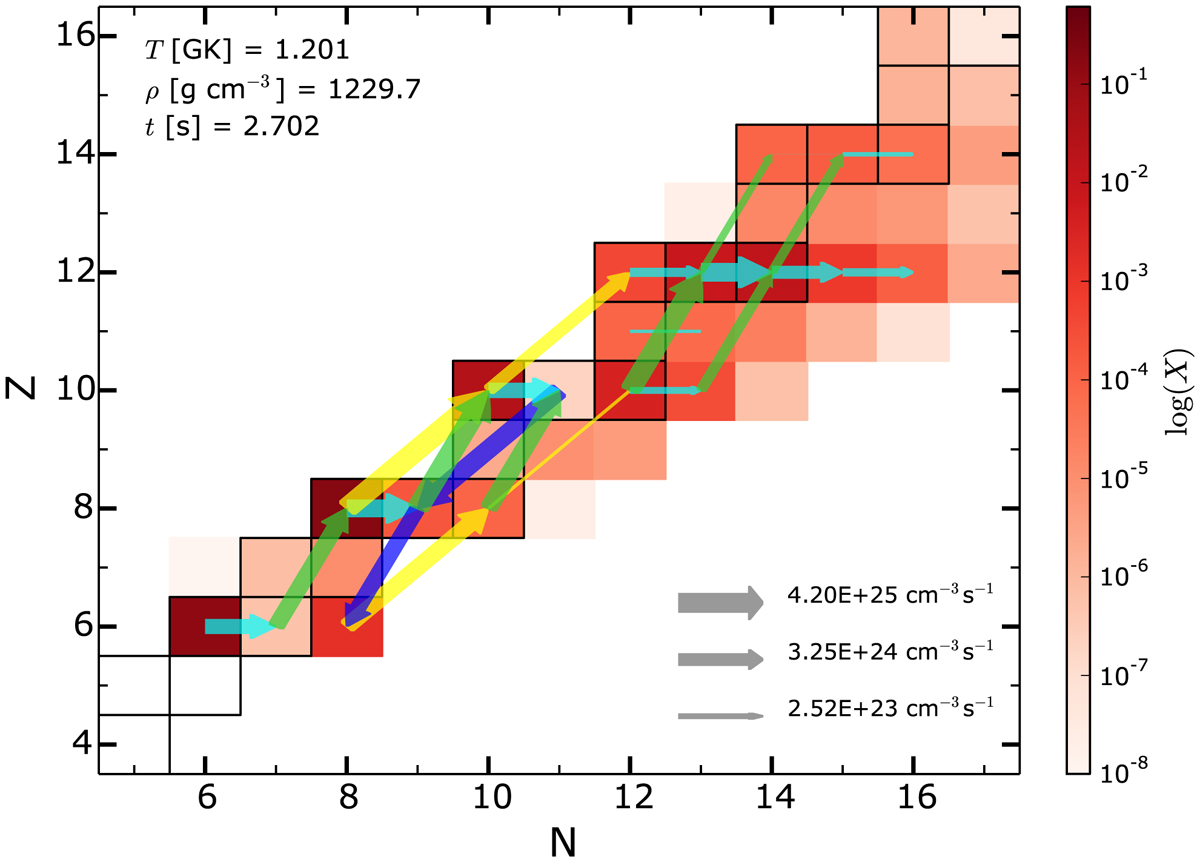
Flowchart of a mass particle with Mr, ini = 16.53 M⊙ (i.e. originally in the helium shell, cf. Fig. 1) and θini = 3.15° at its temperature peak. Mass fractions of isotopes are shown by the red colourmap. Black squares denote stable isotopes. Net reaction rates, considering forward and reverse reactions, are shown by arrows. Arrows are coloured as a function of the reaction type: yellow for (α, γ), cyan for (n, γ), green for (α, n), and blue for (γ, α) and (n, α). Rates below 7 × 1022 cm s−1 are not shown.
Current usage metrics show cumulative count of Article Views (full-text article views including HTML views, PDF and ePub downloads, according to the available data) and Abstracts Views on Vision4Press platform.
Data correspond to usage on the plateform after 2015. The current usage metrics is available 48-96 hours after online publication and is updated daily on week days.
Initial download of the metrics may take a while.