Fig. 12.
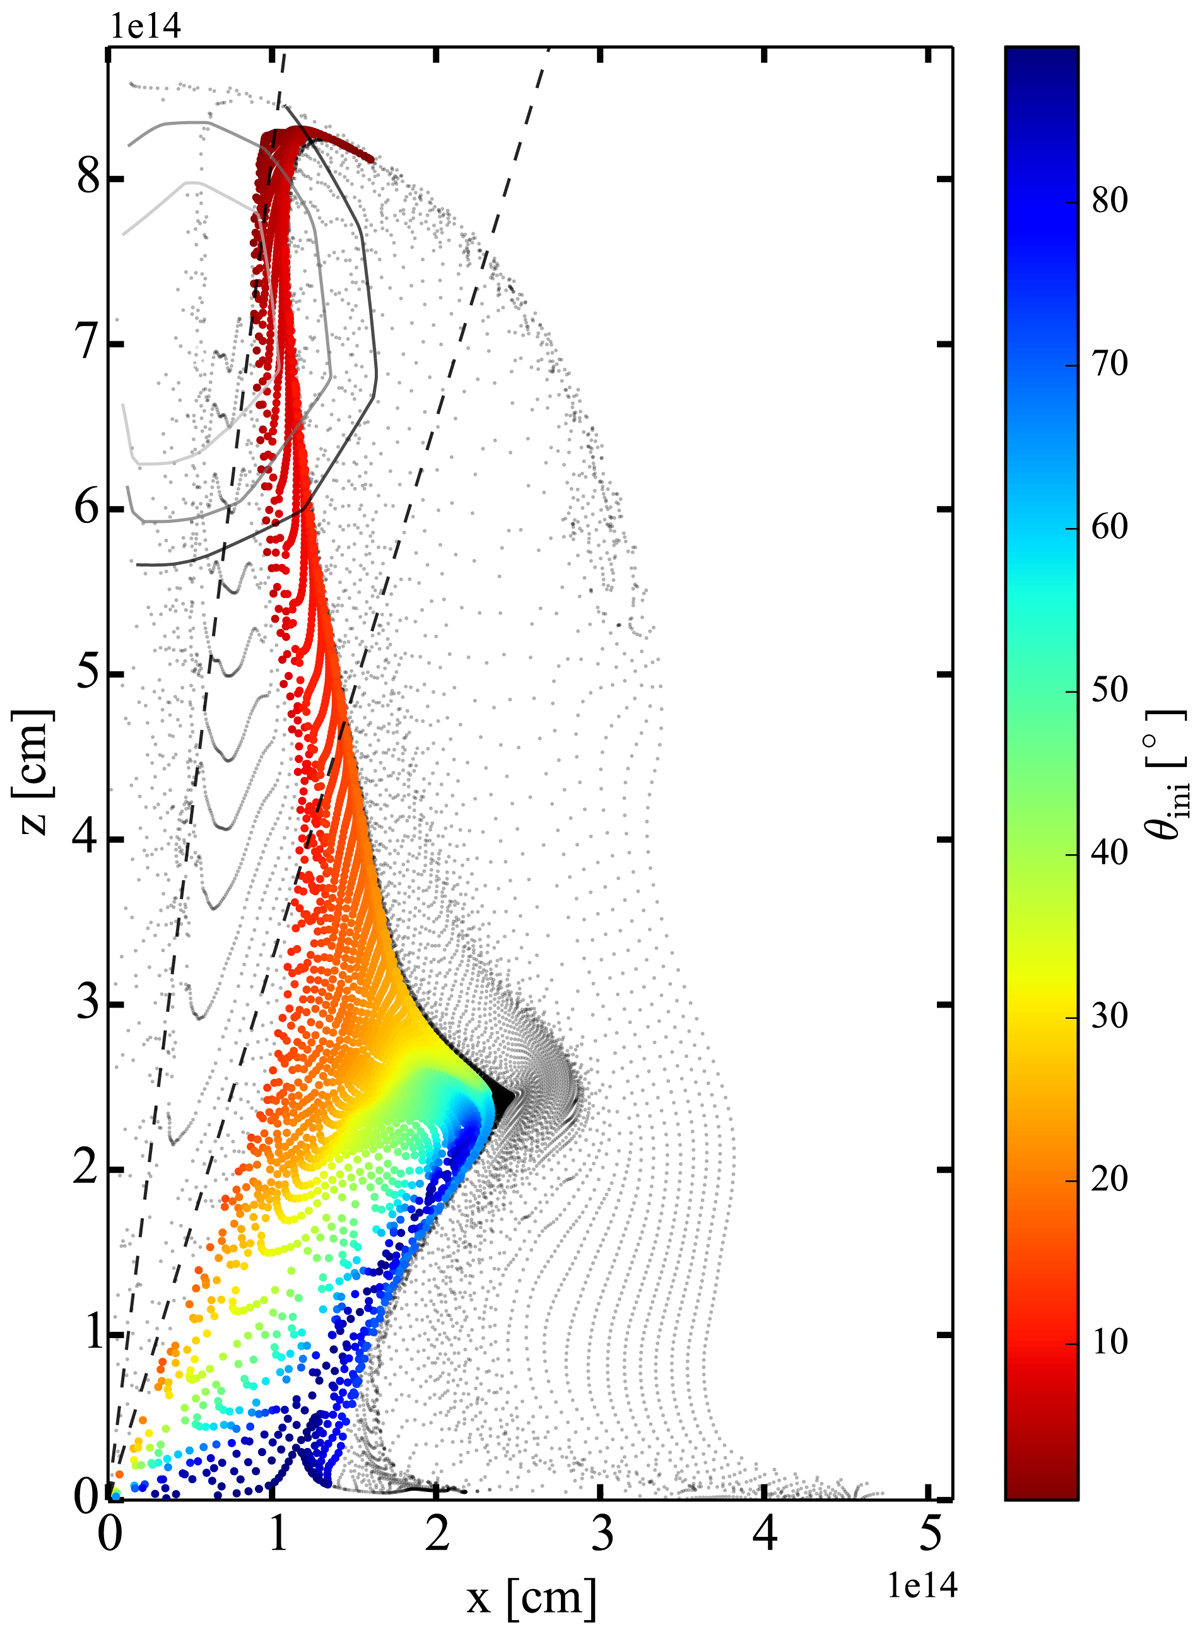
Location of the mass particles at t = 5 × 10⁵ s. The coloured particles represent the particles originally in the helium shell. The colourmap shows the initial angles of these particles. The two dashed lines show θ = 7 and 17°. Iso-velocity contours are shown for particles that have the highest velocities (vfin > 0.04 c). Lighter contours correspond to higher velocities.
Current usage metrics show cumulative count of Article Views (full-text article views including HTML views, PDF and ePub downloads, according to the available data) and Abstracts Views on Vision4Press platform.
Data correspond to usage on the plateform after 2015. The current usage metrics is available 48-96 hours after online publication and is updated daily on week days.
Initial download of the metrics may take a while.