Fig. 11.
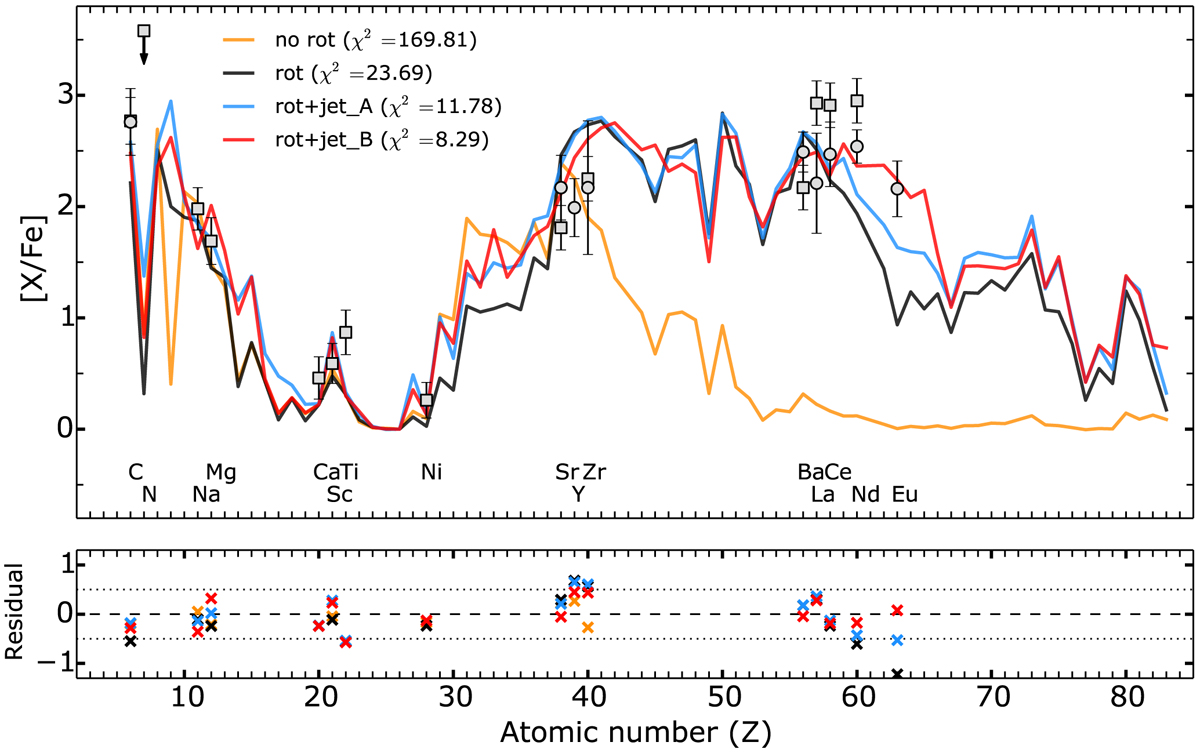
Best fits (top panel) and their residuals (bottom panel) for the metal-poor star CS29528-028. The squares are the abundances from Aoki et al. (2007), and the circles are from Allen et al. (2012). Only an upper limit was derived for nitrogen. When two measurements were available for one element, the most recent one (Allen et al. 2012) was selected to calculate χ2 and used to plot the residuals. The four patterns show the best fits and their χ2 value for four models (cf. text for details). All models were considered after beta decay.
Current usage metrics show cumulative count of Article Views (full-text article views including HTML views, PDF and ePub downloads, according to the available data) and Abstracts Views on Vision4Press platform.
Data correspond to usage on the plateform after 2015. The current usage metrics is available 48-96 hours after online publication and is updated daily on week days.
Initial download of the metrics may take a while.