Free Access
Fig. 4
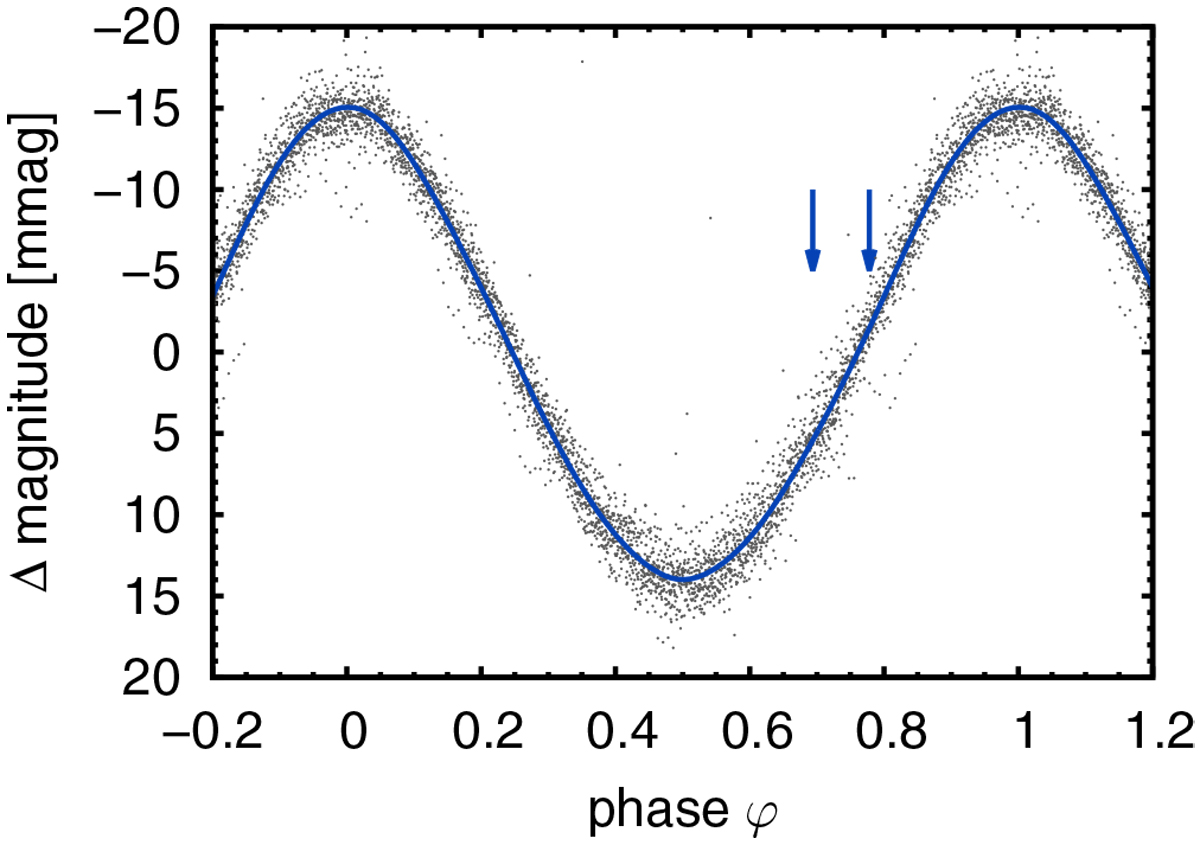
Light variations of KIC 249660366. The solid blue line denotes a fit by the spot model of Prvák (2019). The blue arrows correspond to the phases when the spectra in Table 1 were taken.
Current usage metrics show cumulative count of Article Views (full-text article views including HTML views, PDF and ePub downloads, according to the available data) and Abstracts Views on Vision4Press platform.
Data correspond to usage on the plateform after 2015. The current usage metrics is available 48-96 hours after online publication and is updated daily on week days.
Initial download of the metrics may take a while.