Free Access
Fig. 2
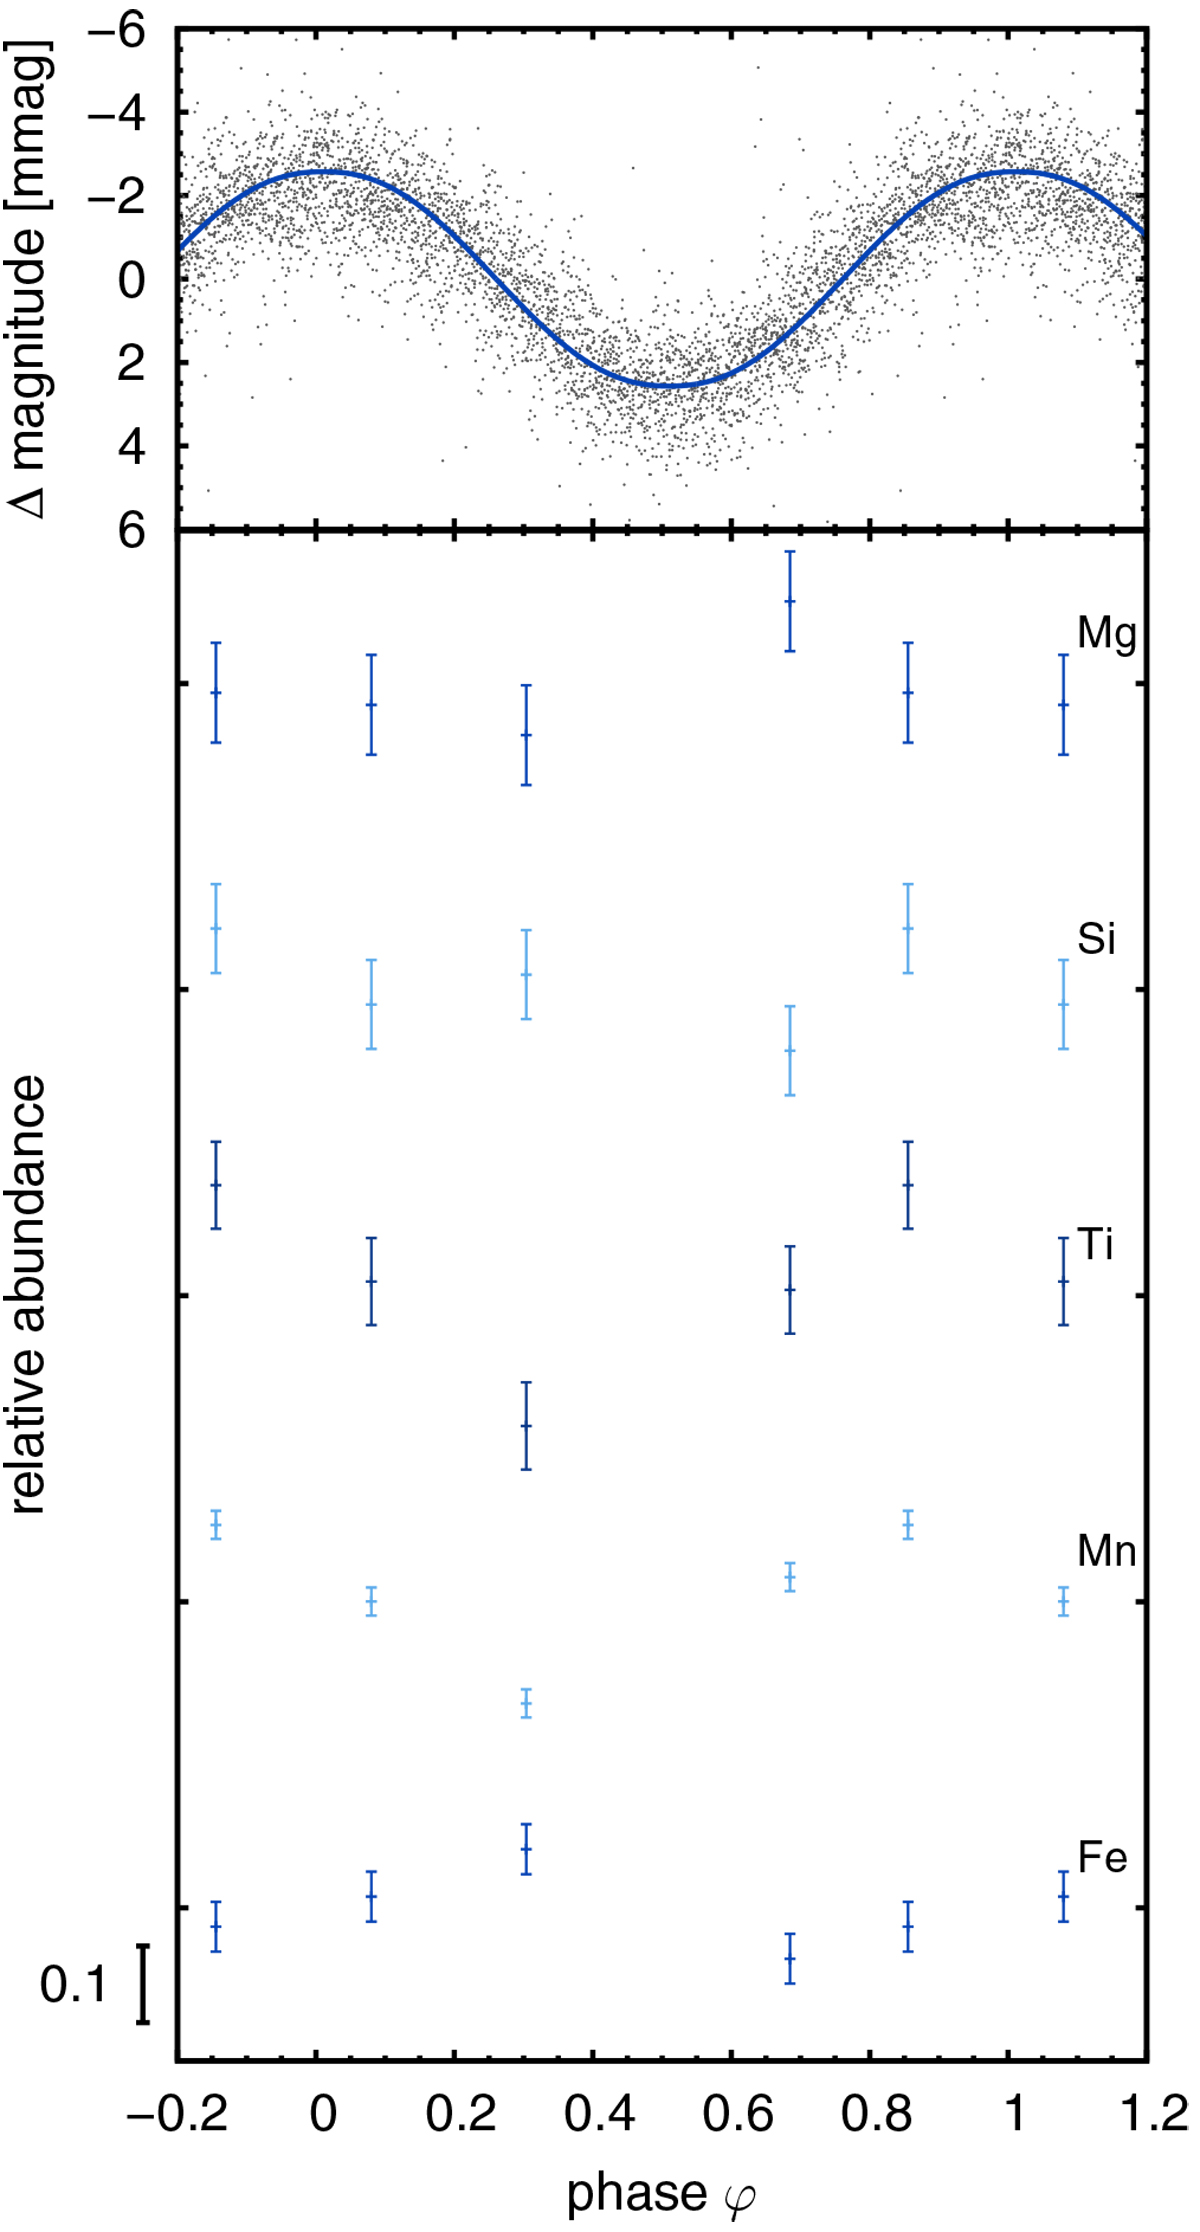
Phase variations of KIC 250152017. Upper panel: K2 magnitudes. The solid line denotes a light curve simulated assuming surface abundance spots of manganese and iron corresponding to the observed spectral variations. Bottom panel: relative variations of abundances. Uncertainties were determined following Hosek et al. (2014).
Current usage metrics show cumulative count of Article Views (full-text article views including HTML views, PDF and ePub downloads, according to the available data) and Abstracts Views on Vision4Press platform.
Data correspond to usage on the plateform after 2015. The current usage metrics is available 48-96 hours after online publication and is updated daily on week days.
Initial download of the metrics may take a while.