Fig. 3.
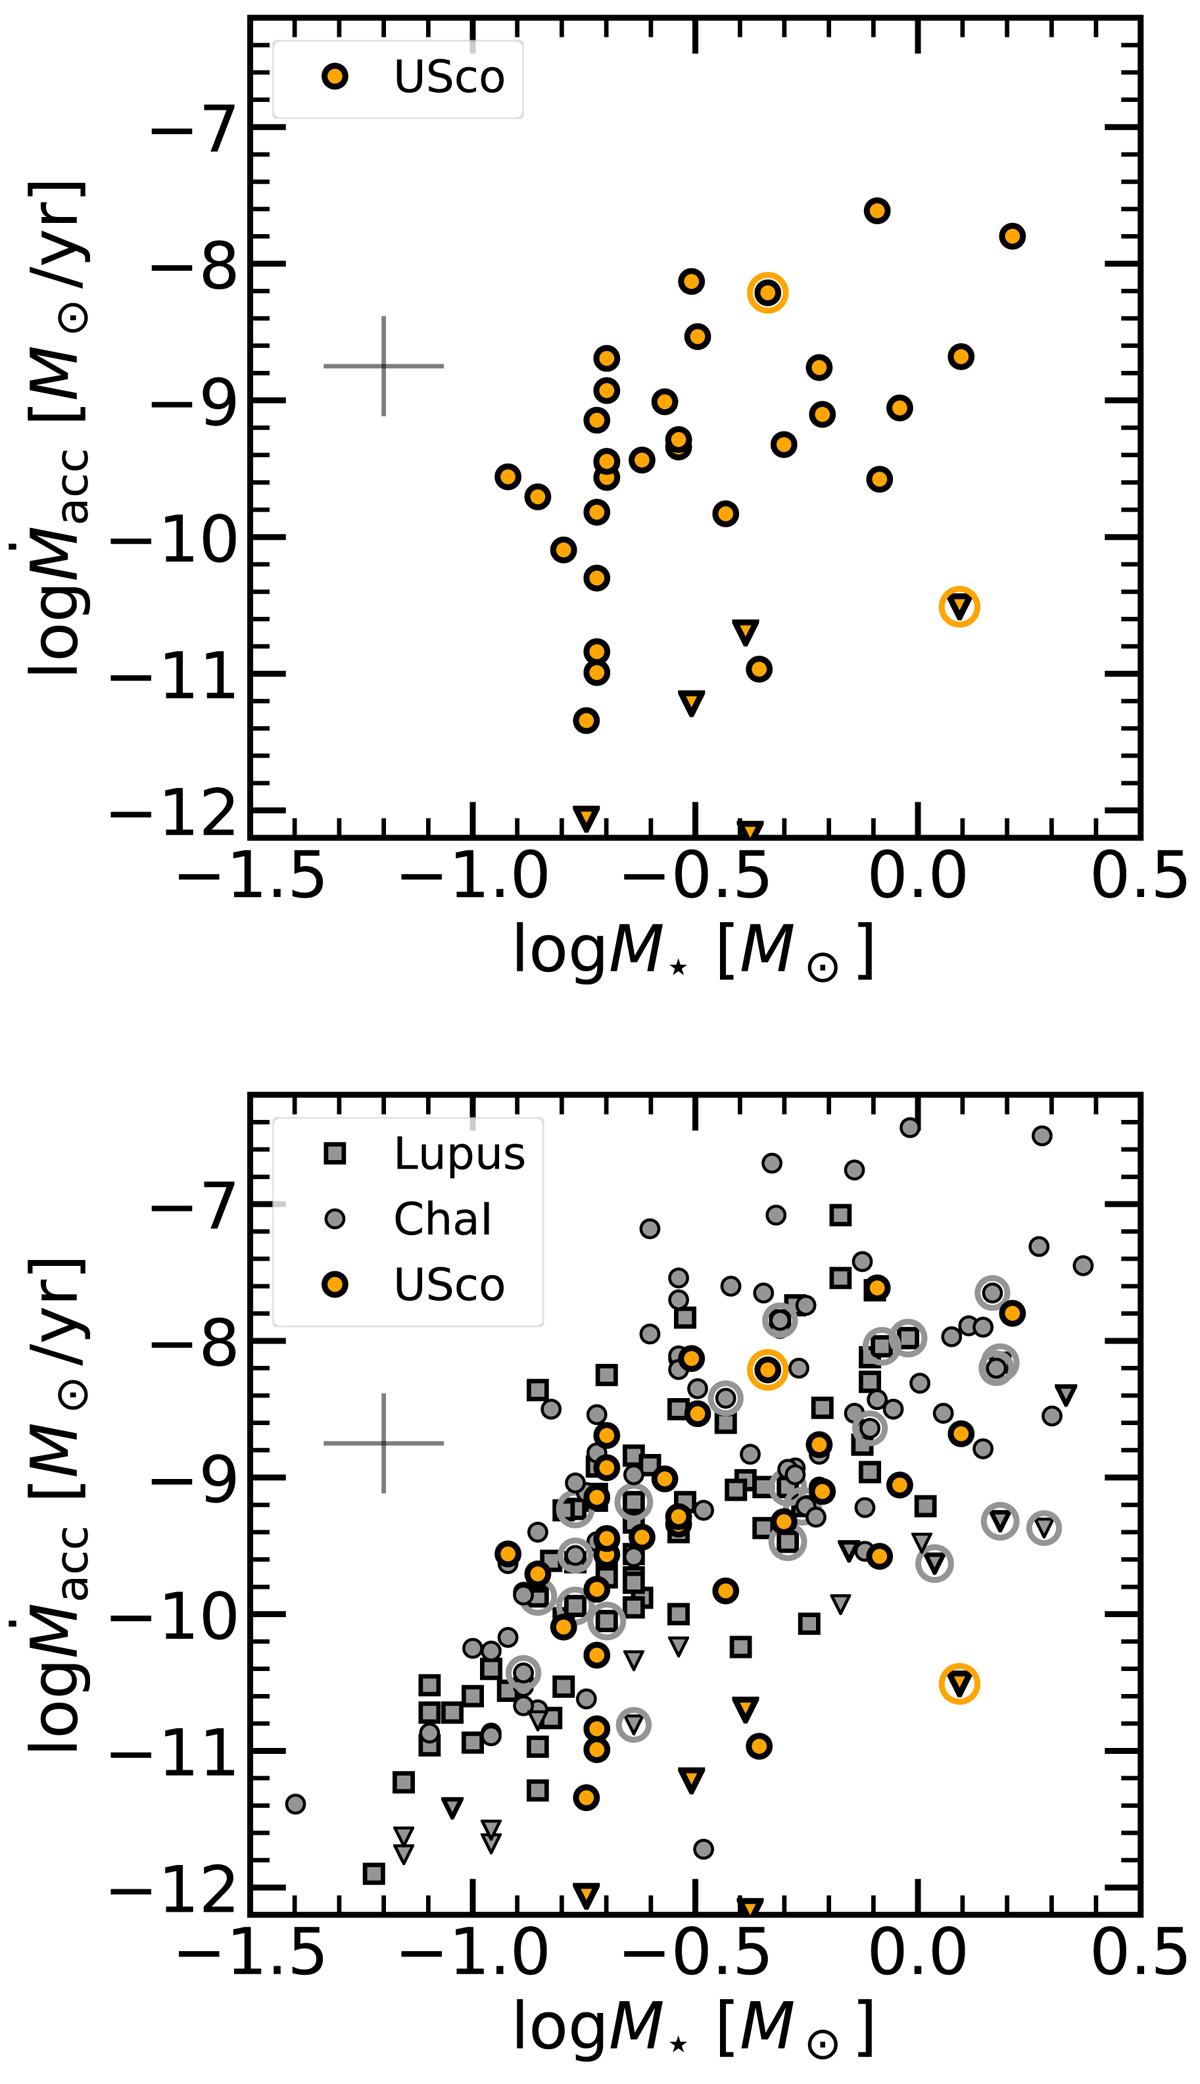
Mass accretion rate vs stellar mass for the targets in the Upper Scorpius region (orange points, both in the upper and bottom panels) and for the targets in the Lupus and Chamaeleon I regions (gray symbols, bottom panel). The downward facing triangles are used for non-accreting objects, transition disk objects are highlighted with a circle around their symbols. The cross indicates the typical errors on the measurements.
Current usage metrics show cumulative count of Article Views (full-text article views including HTML views, PDF and ePub downloads, according to the available data) and Abstracts Views on Vision4Press platform.
Data correspond to usage on the plateform after 2015. The current usage metrics is available 48-96 hours after online publication and is updated daily on week days.
Initial download of the metrics may take a while.