Free Access
Fig. 2.
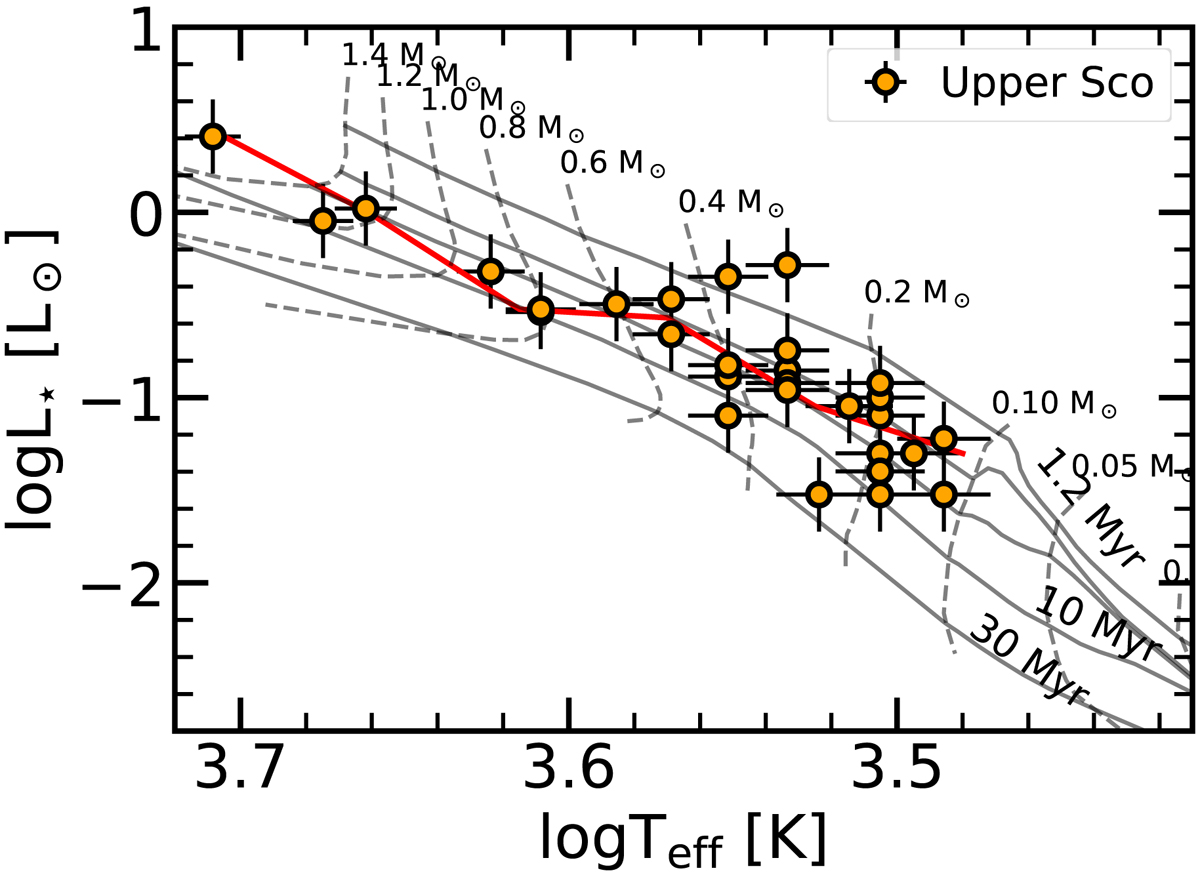
HR diagram for objects in Upper Scorpius observed here. The evolutionary tracks are from Baraffe et al. (2015), with isochrones for 1.2, 3, 5, 10, and 30 Myr. The red line is the median of the L⋆ in different Teff bins.
Current usage metrics show cumulative count of Article Views (full-text article views including HTML views, PDF and ePub downloads, according to the available data) and Abstracts Views on Vision4Press platform.
Data correspond to usage on the plateform after 2015. The current usage metrics is available 48-96 hours after online publication and is updated daily on week days.
Initial download of the metrics may take a while.