Fig. 1.
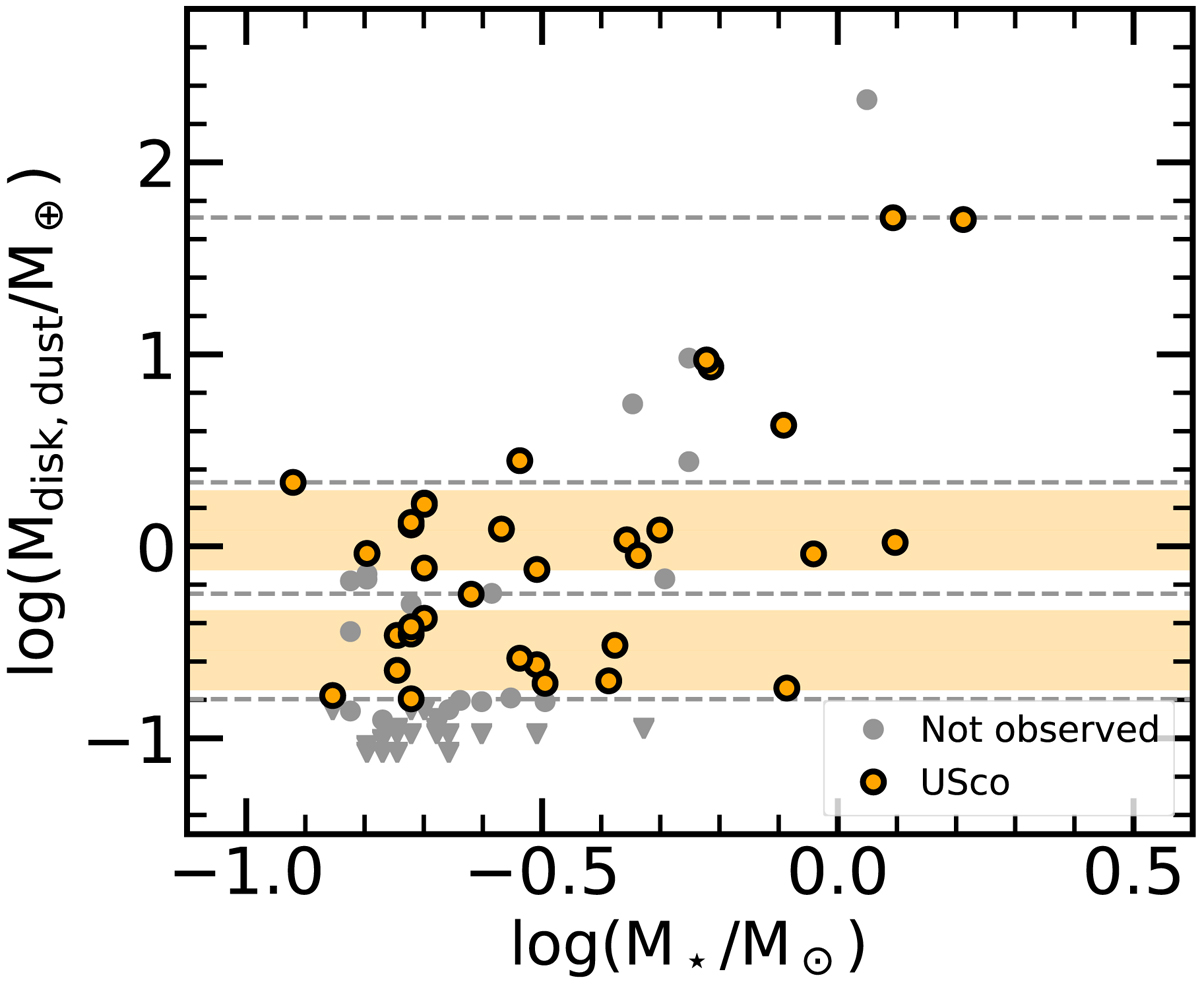
Disk mass vs stellar mass after correcting the disk masses for the Gaia estimated distances and using the stellar masses derived here. Orange circles are used for targets observed with X-shooter, gray symbols for targets not observed, circles for ALMA detections, downward facing triangles for ALMA upper limits. The shaded regions delimit the disk mass ranges where the sample is complete with respect to the Barenfeld et al. (2016) one. The dashed gray lines delimit the bins used in the discussion. For the objects not observed with X-shooter, the distances, disk, and stellar masses from the literature are adopted.
Current usage metrics show cumulative count of Article Views (full-text article views including HTML views, PDF and ePub downloads, according to the available data) and Abstracts Views on Vision4Press platform.
Data correspond to usage on the plateform after 2015. The current usage metrics is available 48-96 hours after online publication and is updated daily on week days.
Initial download of the metrics may take a while.