Free Access
Fig. 13
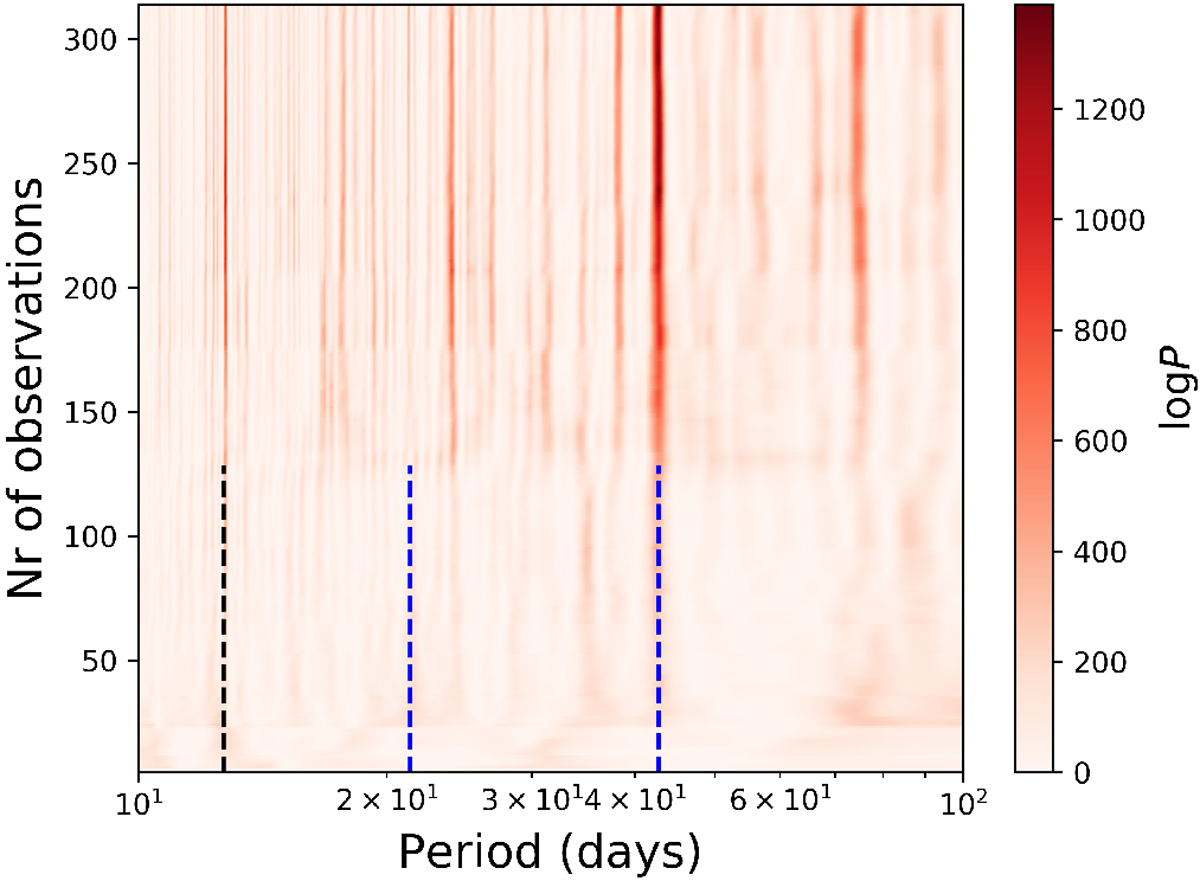
Stacked Bayesian General Lomb-Scargle periodogram applied to the HARPS-N residuals of the two-planets fit. The colour bar indicates the Bayesian probability of the signals. The rotation period with its first harmonics (blue dashed lines) and the orbital period of planet d (black dashed line) are also indicated.
Current usage metrics show cumulative count of Article Views (full-text article views including HTML views, PDF and ePub downloads, according to the available data) and Abstracts Views on Vision4Press platform.
Data correspond to usage on the plateform after 2015. The current usage metrics is available 48-96 hours after online publication and is updated daily on week days.
Initial download of the metrics may take a while.