Free Access
Fig. 9
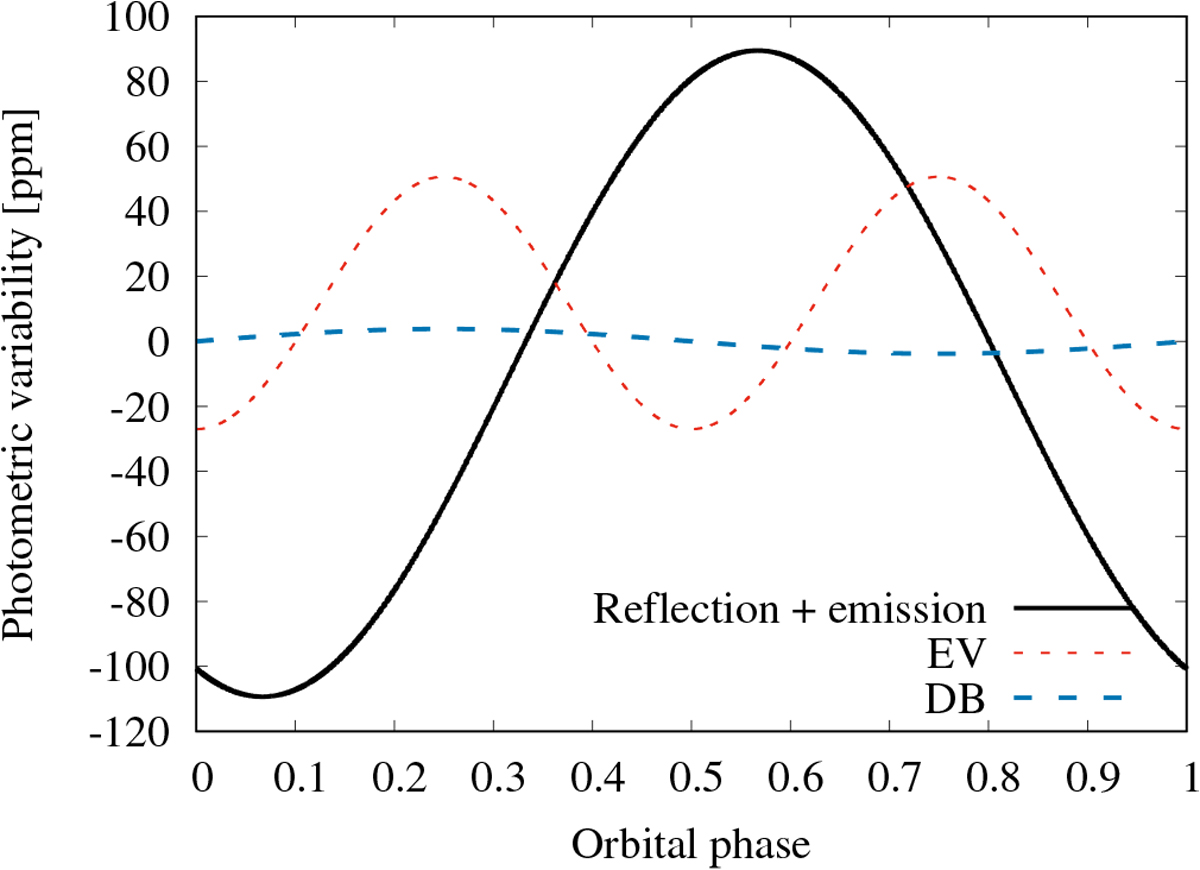
Photometric variability in ppm given by reflection and emission shown as the black continuous line, the EV as the red dotted line, and the DB as the blue dashed line, as derived in this work. Values are placed around zero to allow for visual comparison.
Current usage metrics show cumulative count of Article Views (full-text article views including HTML views, PDF and ePub downloads, according to the available data) and Abstracts Views on Vision4Press platform.
Data correspond to usage on the plateform after 2015. The current usage metrics is available 48-96 hours after online publication and is updated daily on week days.
Initial download of the metrics may take a while.