Fig. A.1
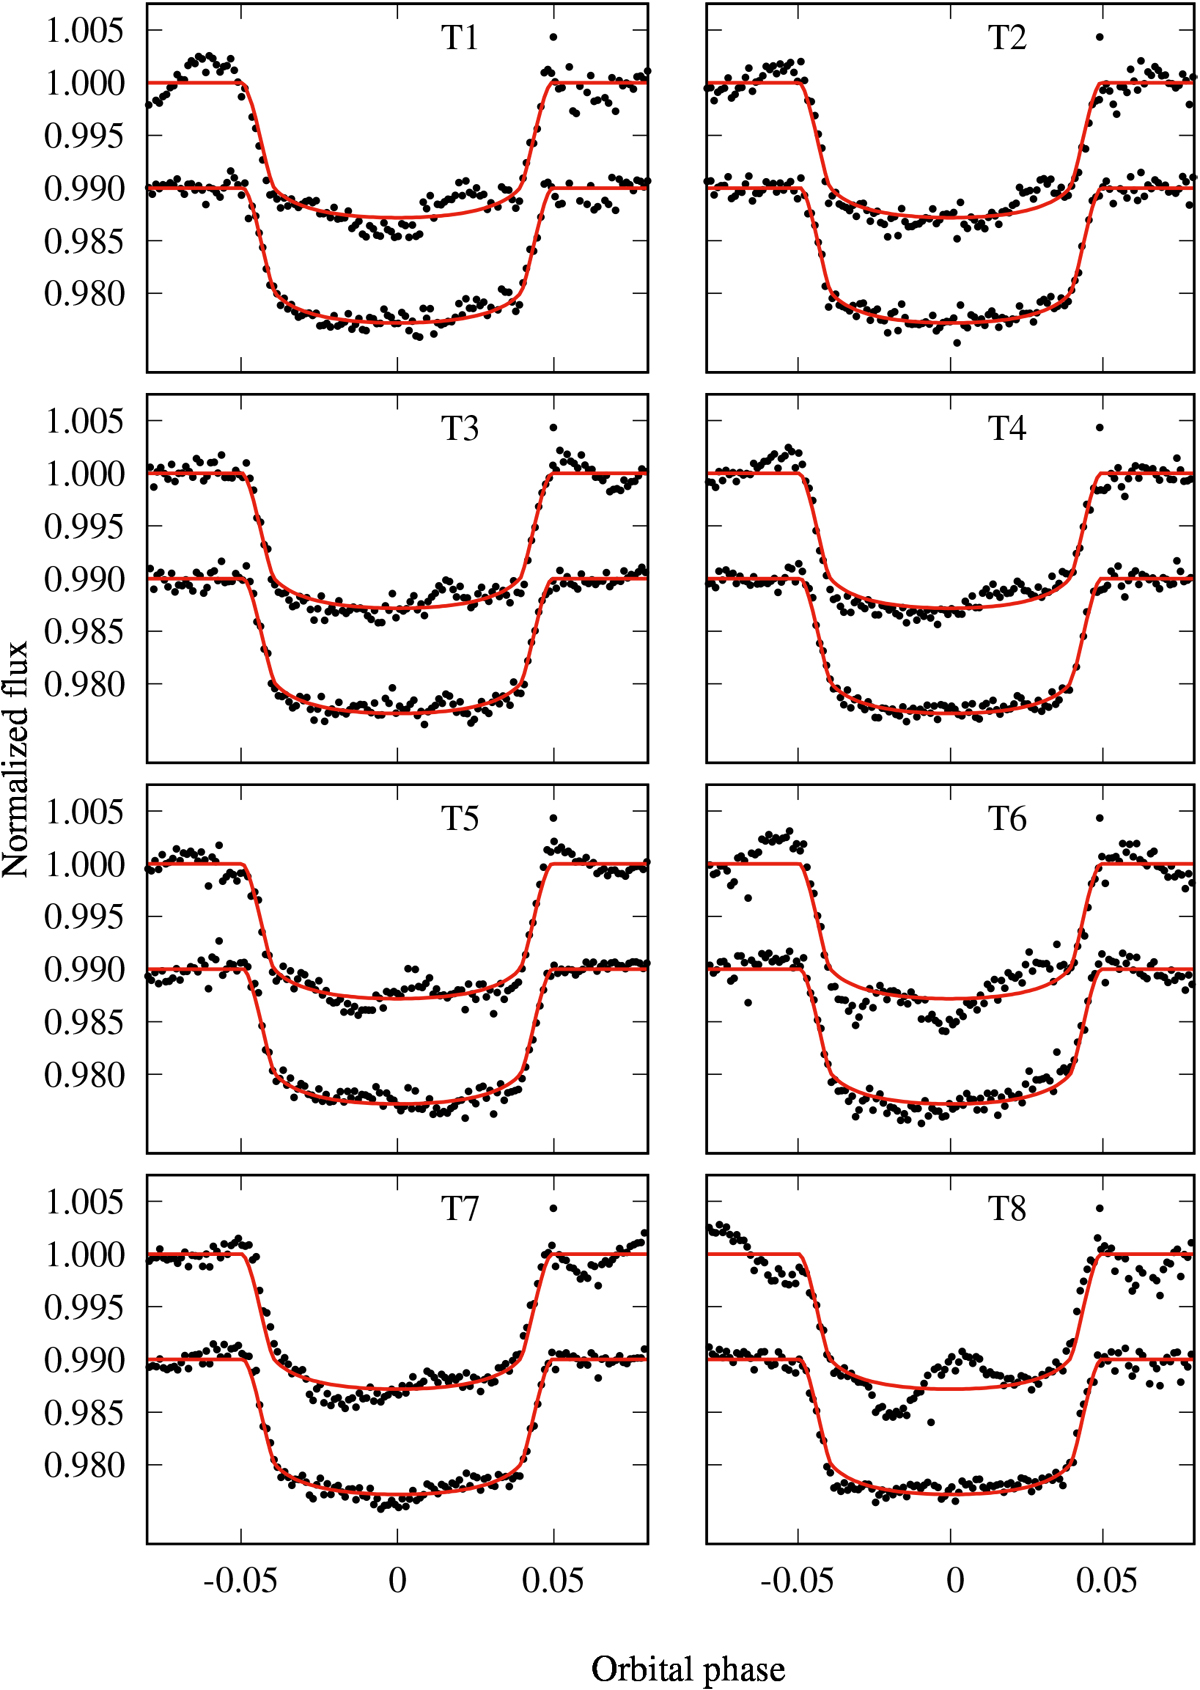
Normalized flux as a function of orbital phase for the primary transits of WASP-33b observed by TESS. From top to bottom and left to right: time evolves. TESS observations are in black points, and the best-fit model in red continuous line. Individual error bars are not plotted to better visualize the effect of the pulsations over the photometry.
Current usage metrics show cumulative count of Article Views (full-text article views including HTML views, PDF and ePub downloads, according to the available data) and Abstracts Views on Vision4Press platform.
Data correspond to usage on the plateform after 2015. The current usage metrics is available 48-96 hours after online publication and is updated daily on week days.
Initial download of the metrics may take a while.