Fig. 12
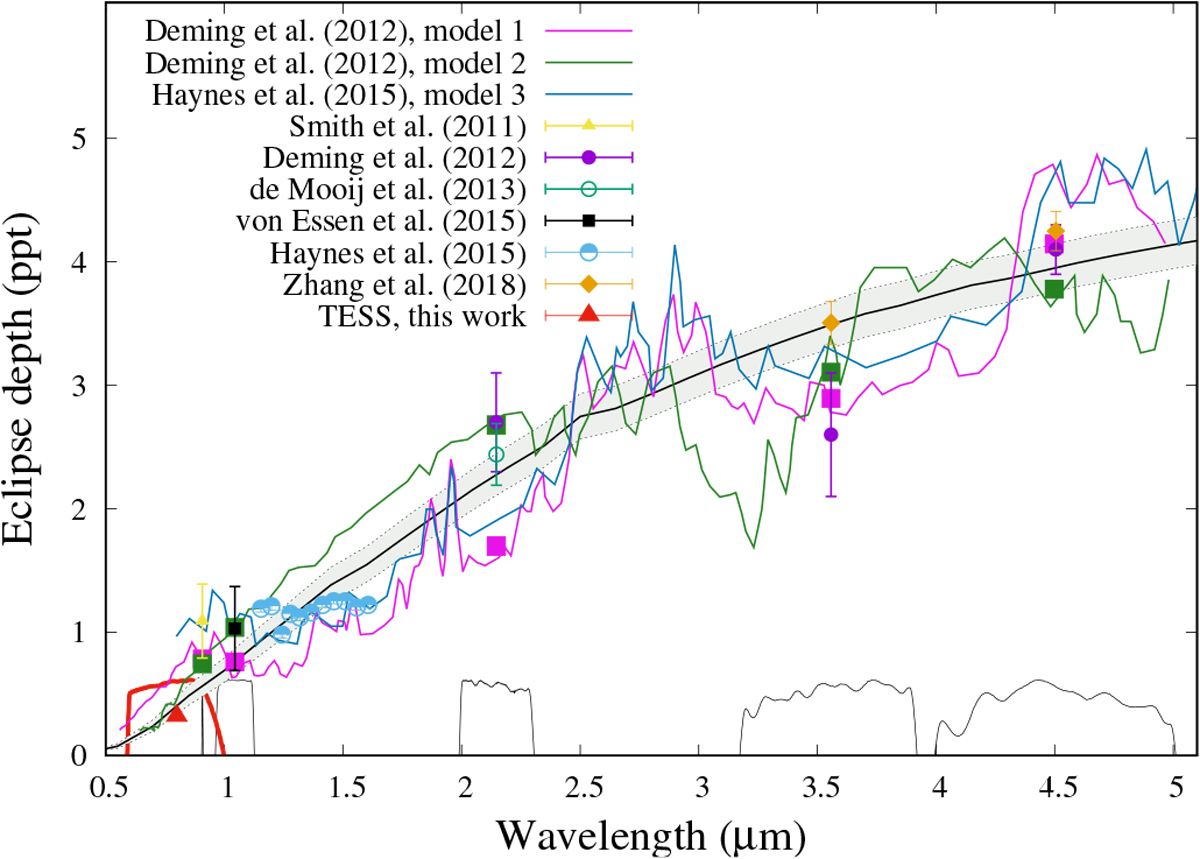
Eclipse depth, in ppt, as a function of wavelength. The red triangle corresponds to the TESS value, reported in this work. Error bars are included in the size of the point. The gray area shows 1σ contour of the equilibrium temperature of WASP-33b. Literature measurements come from Smith et al. (2011) (triangle in yellow) Deming et al. (2012) (circles in violet), de Mooij et al. (2013) (empty circle in green) von Essen et al. (2015) (square in black), Haynes et al. (2015) (half-filled circles in blue), Zhang et al. (2018) (diamonds in yellow). Transmission responses are plotted as black continuous lines, with the exception of TESS, which is highlighted in red. Green and pink squares show Deming et al. (2012)’s models binned to their respective filters.
Current usage metrics show cumulative count of Article Views (full-text article views including HTML views, PDF and ePub downloads, according to the available data) and Abstracts Views on Vision4Press platform.
Data correspond to usage on the plateform after 2015. The current usage metrics is available 48-96 hours after online publication and is updated daily on week days.
Initial download of the metrics may take a while.