Fig. 11
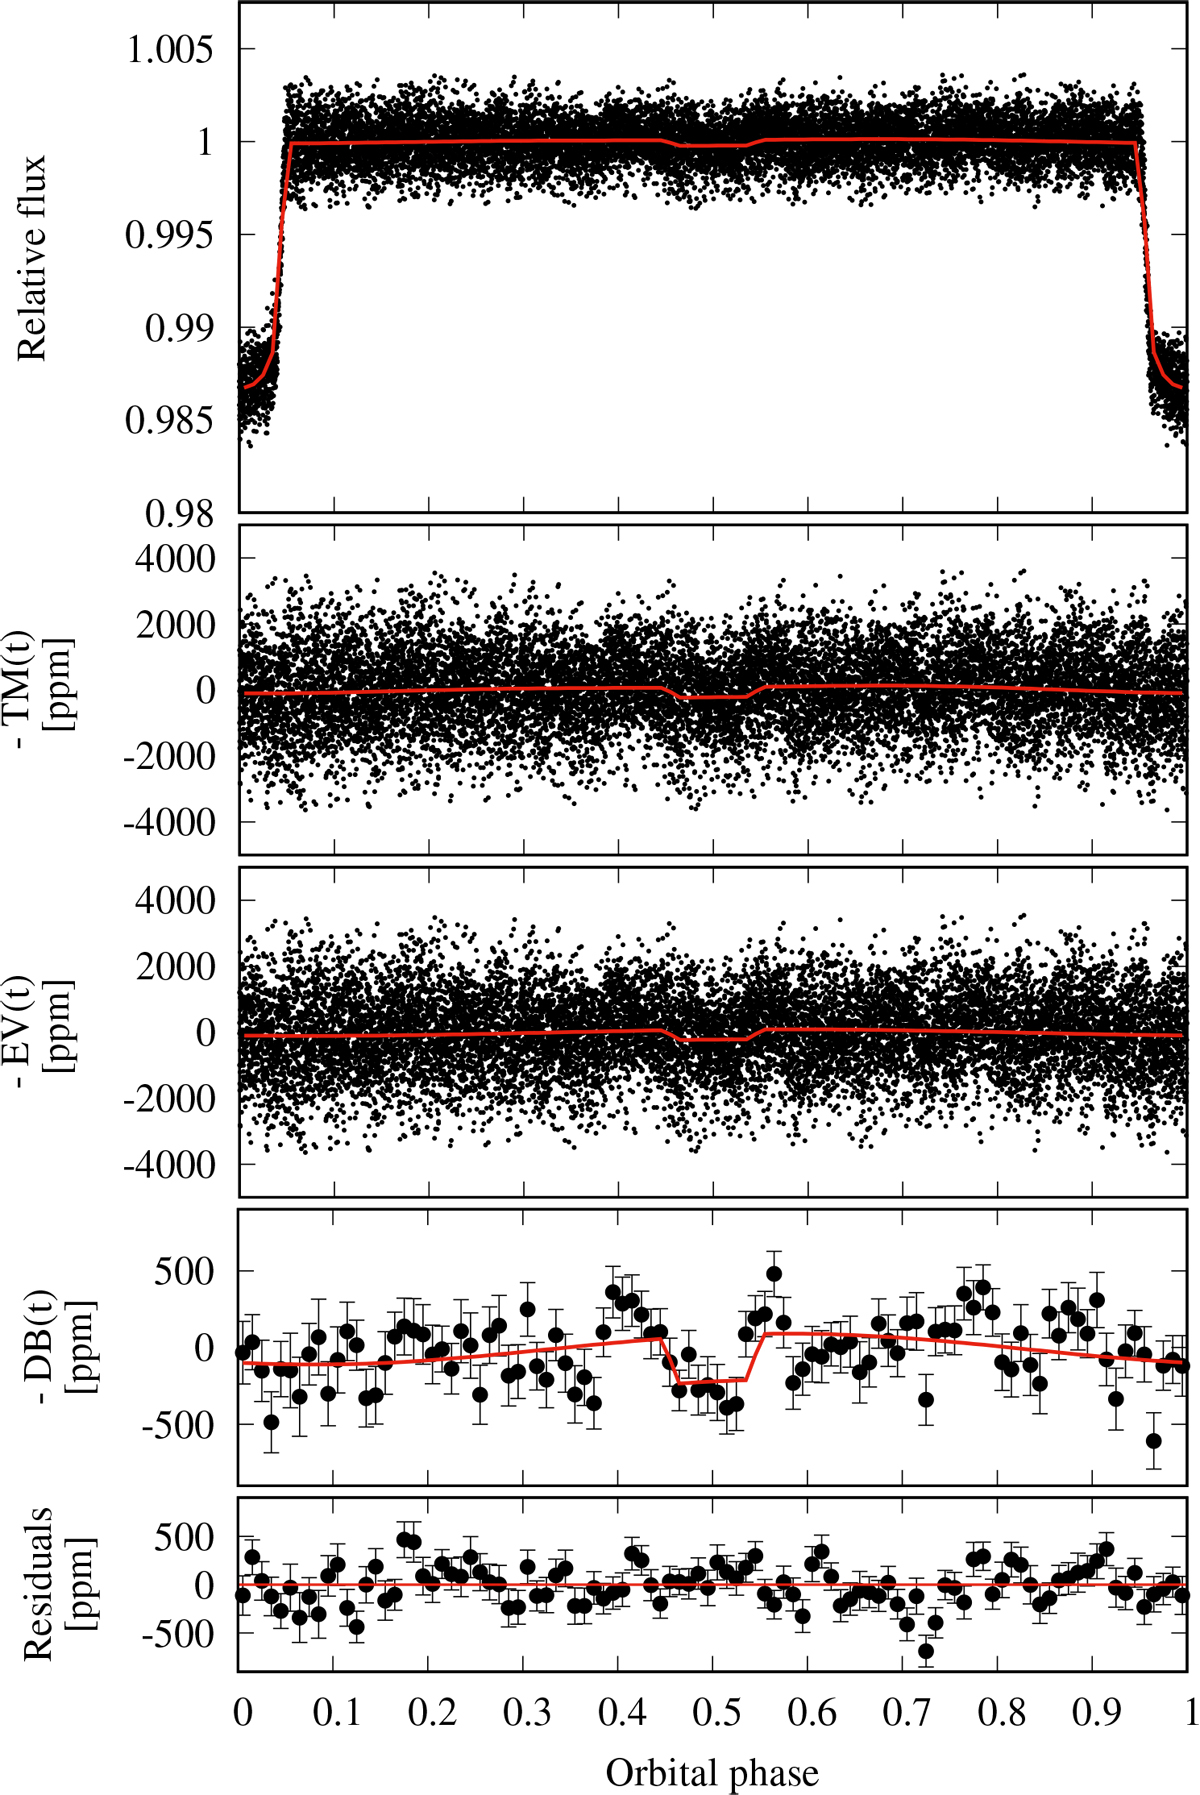
From top to bottom: phase-folded light curve of WASP-33 presented as black points showing the primary transit around phases 0,1 and the residual pulsations of the host star; relative flux of WASP-33 in parts per million (ppm) after removing the primary TM (second panel), the EV (third panel), and the DB (fourth panel). Last two panels: data binned at ϕ = 0.01 with the secondary eclipse plus phase curve at the top, and residuals from the best-fit model at the bottom. Red lines always showthe different components of the best-fit model.
Current usage metrics show cumulative count of Article Views (full-text article views including HTML views, PDF and ePub downloads, according to the available data) and Abstracts Views on Vision4Press platform.
Data correspond to usage on the plateform after 2015. The current usage metrics is available 48-96 hours after online publication and is updated daily on week days.
Initial download of the metrics may take a while.