Fig. 10
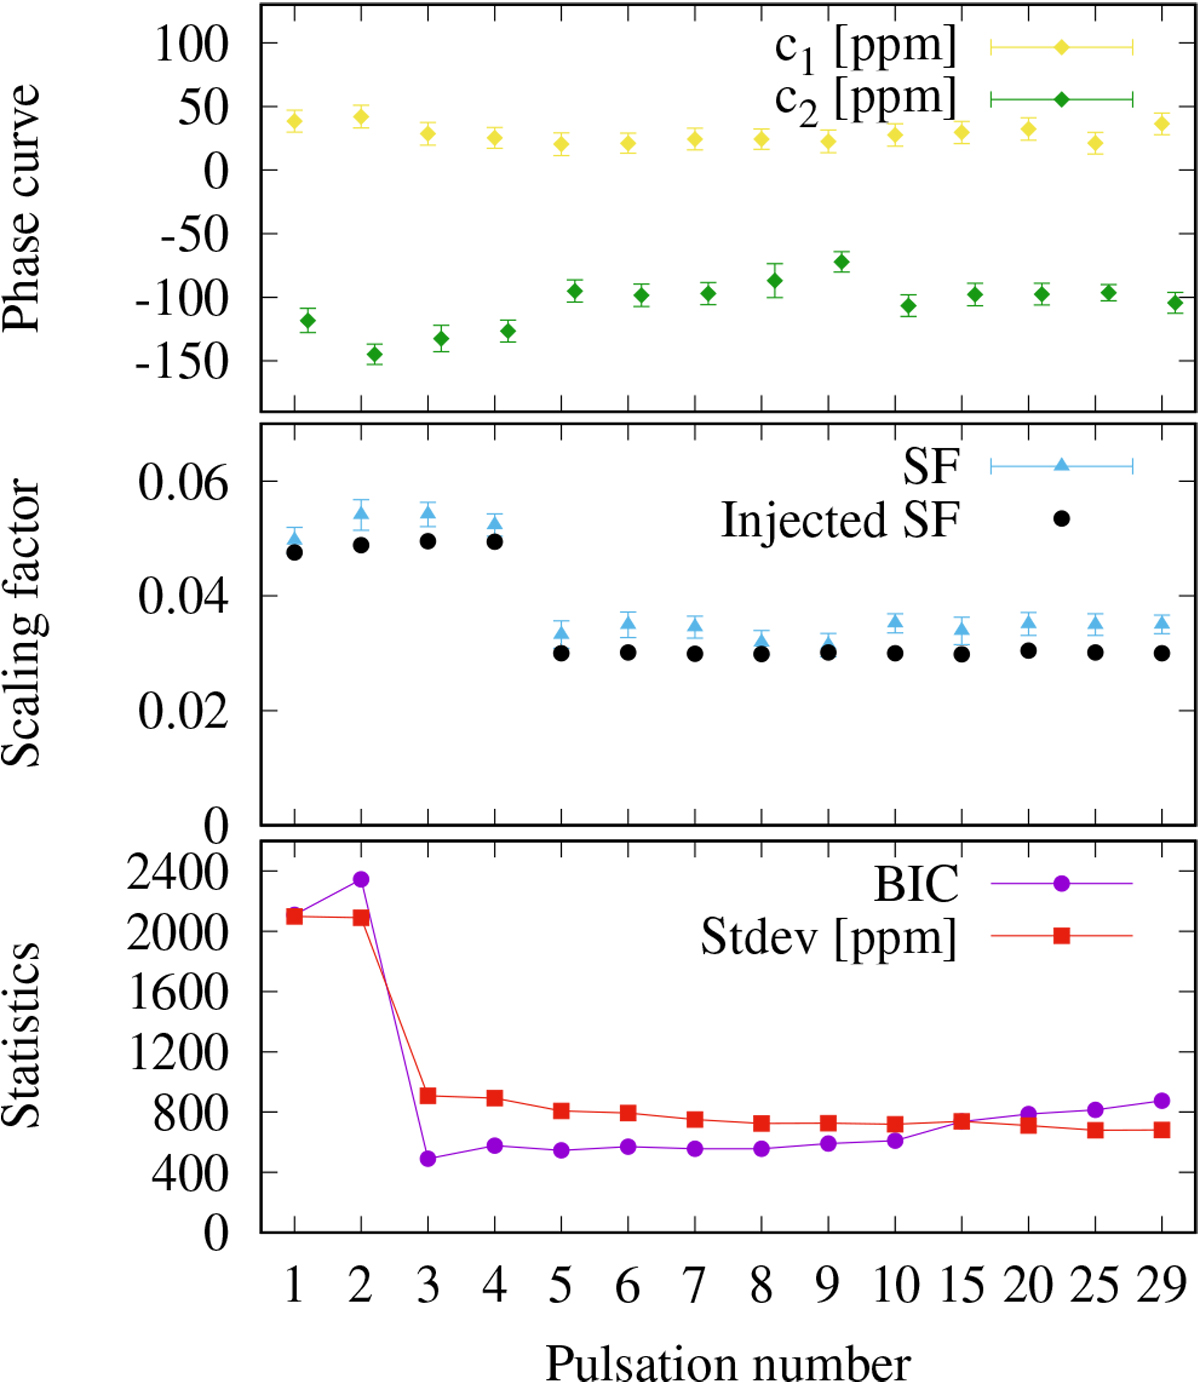
Evolution of relevant parameters as a function of the number of pulsations considered to remove from the data. From top to bottom: the phase curve coefficients, c1 and c2, are shown as green points; the scaling factor and its injected counterpart are plotted as blue triangles and black circles, respectively,see text for details; and two statistics, the BIC as red circles and the standard deviation of the residual light curves as black squares, which was enlarged by a factor of 5 for better visualization.
Current usage metrics show cumulative count of Article Views (full-text article views including HTML views, PDF and ePub downloads, according to the available data) and Abstracts Views on Vision4Press platform.
Data correspond to usage on the plateform after 2015. The current usage metrics is available 48-96 hours after online publication and is updated daily on week days.
Initial download of the metrics may take a while.