Free Access
Fig. 1
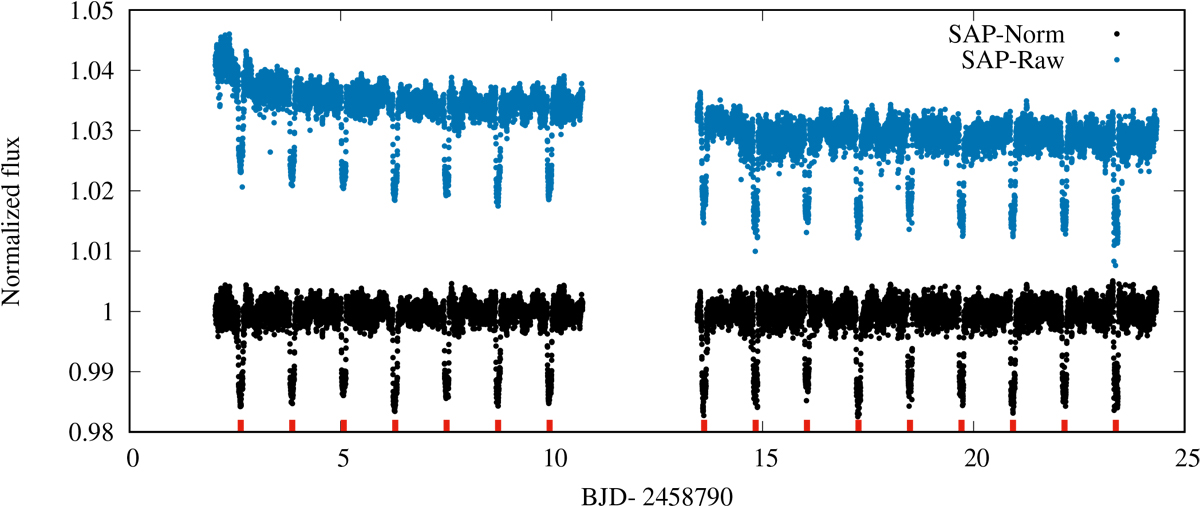
SAP normalized flux of WASP-33 observed by TESS shown as black circles, along with SAP raw data in blue. The pulsations of the star deform the continuum level. The 16 transits are indicated at the bottom with red lines. The gap in the middle is caused by data downlink dead time.
Current usage metrics show cumulative count of Article Views (full-text article views including HTML views, PDF and ePub downloads, according to the available data) and Abstracts Views on Vision4Press platform.
Data correspond to usage on the plateform after 2015. The current usage metrics is available 48-96 hours after online publication and is updated daily on week days.
Initial download of the metrics may take a while.