Fig. 3.
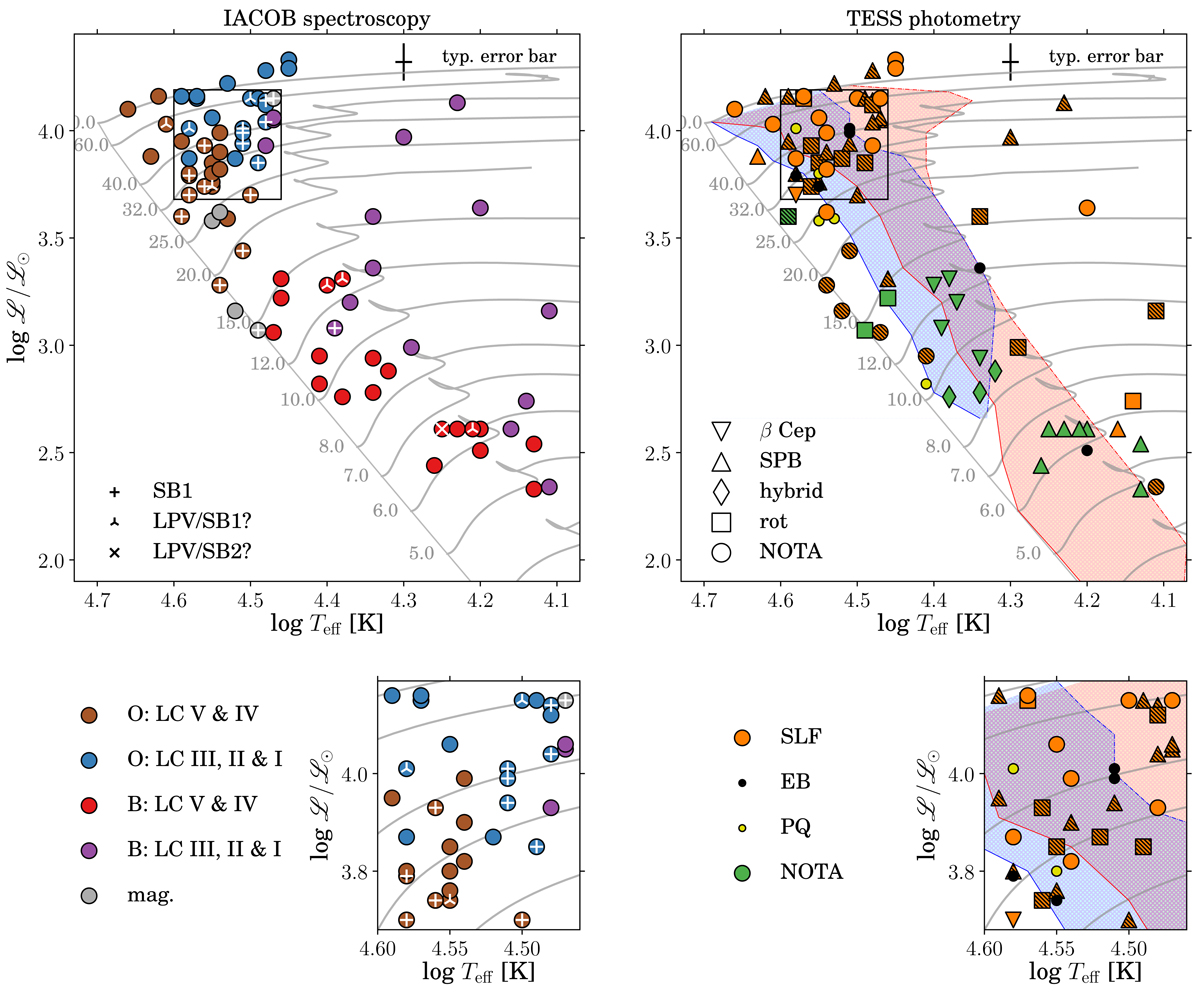
sHRD including stars from Table 2 with determined spectroscopic parameters. Left panels: the stars are sorted following spectral classification criteria (cf. Table 2). A zoom-in of the dense regions is marked by the black quadrant. Stars identified as single line spectroscopic binaries (SB1) or line profile variables due to the effect of pulsations (LPV/SB1? and LPV/SB2?) are highlighted. Right panels: the stars are sorted according to the information provided by the TESS photometric data. The different markers indicate different stable variability seen in the light curves. NOTA indicates “None of the Above”. Hatched symbols mark variable stars where the exact contribution of g modes, wind variability and SLF is difficult to disentangle. The colours indicates if the light curve shows stochastic low frequency variability or not (SLF/NOTA), eclipses (EB), or is of poor quality (PQ). Our MESA evolutionary tracks are given in grey on both sides (cf. Sect. 3). On the right we also plot our calculated instability strips, blue for the p modes (ℓ = 0 − 2) and orange for g modes (ℓ = 1 − 2).
Current usage metrics show cumulative count of Article Views (full-text article views including HTML views, PDF and ePub downloads, according to the available data) and Abstracts Views on Vision4Press platform.
Data correspond to usage on the plateform after 2015. The current usage metrics is available 48-96 hours after online publication and is updated daily on week days.
Initial download of the metrics may take a while.