Fig. A.1.
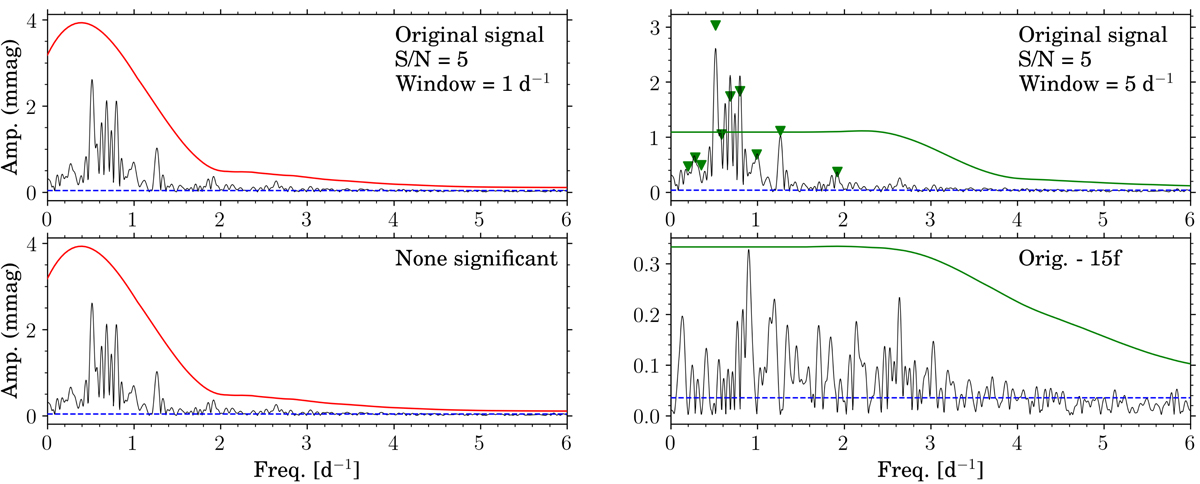
Comparison of the different noise window size calculations for SPB star HD 48977. Left hand side: periodogram of the original signal (top) and residual signal (bottom) after frequency extraction using a significance criterion of S/N = 5 with the noise calculated in a window of 1 d−1 around the frequency. Right hand side: same periodograms but with the noise calculated in a window of 5 d−1 around the frequency. Green markers indicate singificant frequencies. The coloured solid lines represent the significance levels for each periodogram. The blue dashed line indicates the mean noise level over the whole periodogram.
Current usage metrics show cumulative count of Article Views (full-text article views including HTML views, PDF and ePub downloads, according to the available data) and Abstracts Views on Vision4Press platform.
Data correspond to usage on the plateform after 2015. The current usage metrics is available 48-96 hours after online publication and is updated daily on week days.
Initial download of the metrics may take a while.