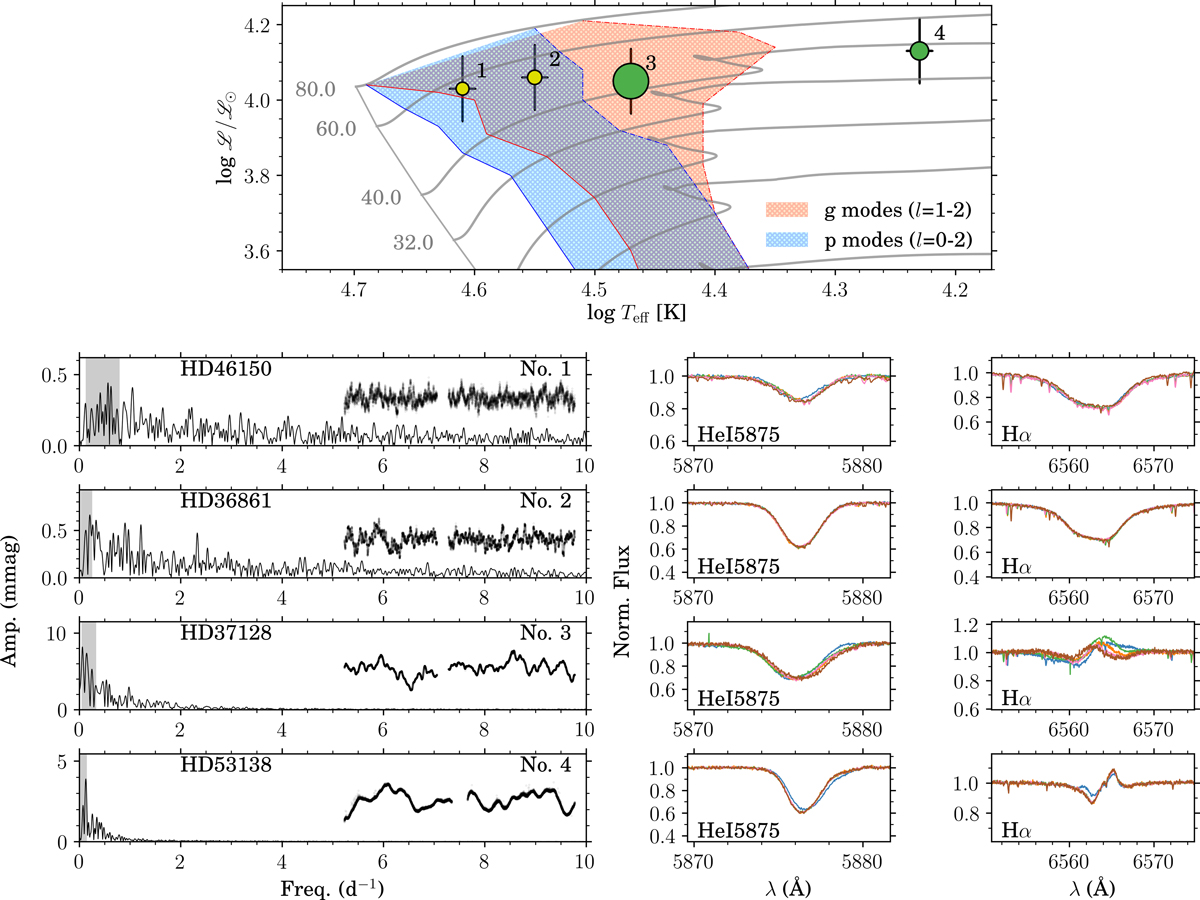
Fig. 15.

High-mass evolutionary sequence. sHRD (top panel) with the size of the symbols scaled to the peak-to-peak value of the light curve (between 7.7 and 63.8 mmag). The colour refers to the spectral type, yellow for O and green for B. We include the evolutionary tracks in grey and the instability strips for Zin = 0.014. For each star marked with a number in the top panel, the LS-periodogram (bottom left panels), and two spectroscopic lines (He Iλ5875 and Hα over multiple epochs bottom right panels) are given. The grey region in the LS-periodogram marks the estimated rotational modulation frequency range (see Sect. 2.3). We show the TESS light curve on the inset of each LS-periodogram (not to scale).
Current usage metrics show cumulative count of Article Views (full-text article views including HTML views, PDF and ePub downloads, according to the available data) and Abstracts Views on Vision4Press platform.
Data correspond to usage on the plateform after 2015. The current usage metrics is available 48-96 hours after online publication and is updated daily on week days.
Initial download of the metrics may take a while.


