Fig. 9.
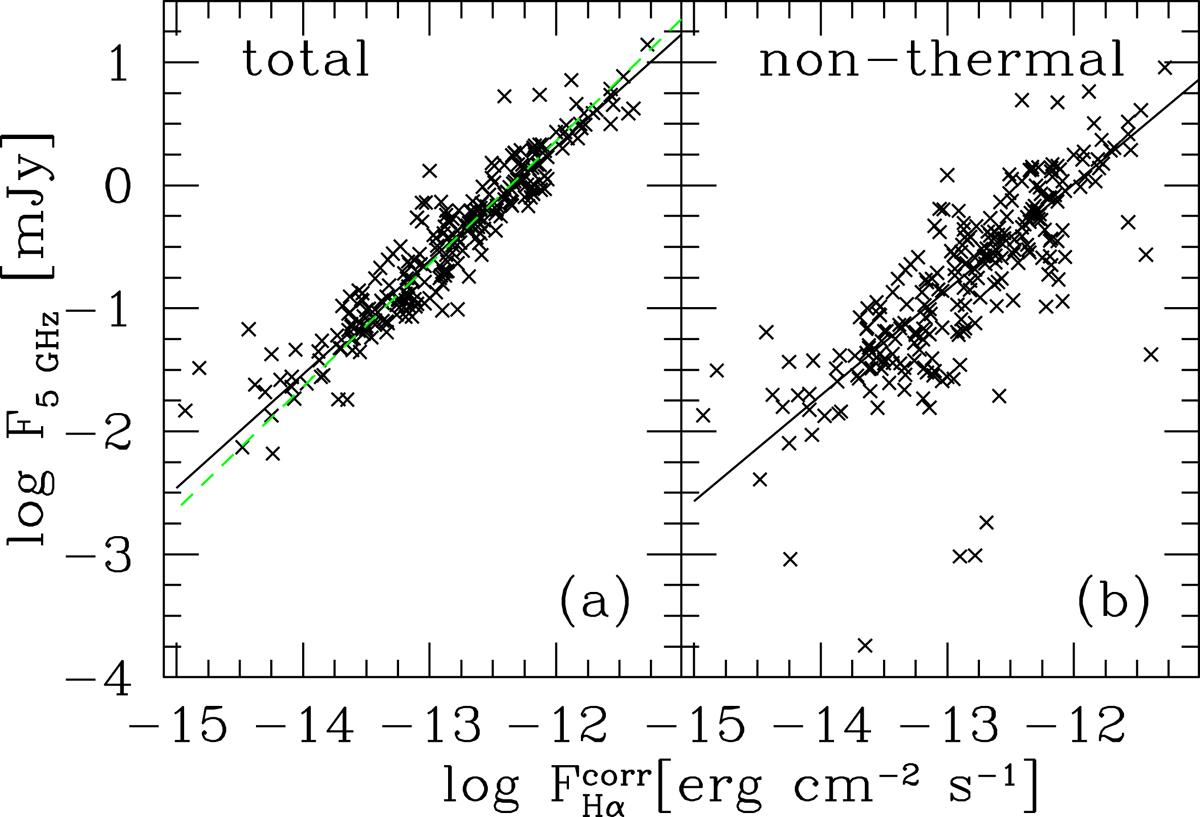
Total (left panel) and nonthermal radio continuum flux (right panel) at 5 GHz for MIR-selected star forming regions plotted as a function of the Hα flux corrected for extinction. The Hα emission appears to be more closely related to the total radio flux than to the nonthermal radio continuum only. The fitted correlations shown are drawn by minimizing distances to the line and their slopes are 0.87 and 0.93 for the total and nonthermal flux respectively. Plotted quantities are relative to circular apertures with Rap = 1.5Rs. The green dashed line is the best fitted line with slope unity.
Current usage metrics show cumulative count of Article Views (full-text article views including HTML views, PDF and ePub downloads, according to the available data) and Abstracts Views on Vision4Press platform.
Data correspond to usage on the plateform after 2015. The current usage metrics is available 48-96 hours after online publication and is updated daily on week days.
Initial download of the metrics may take a while.