Fig. 7.
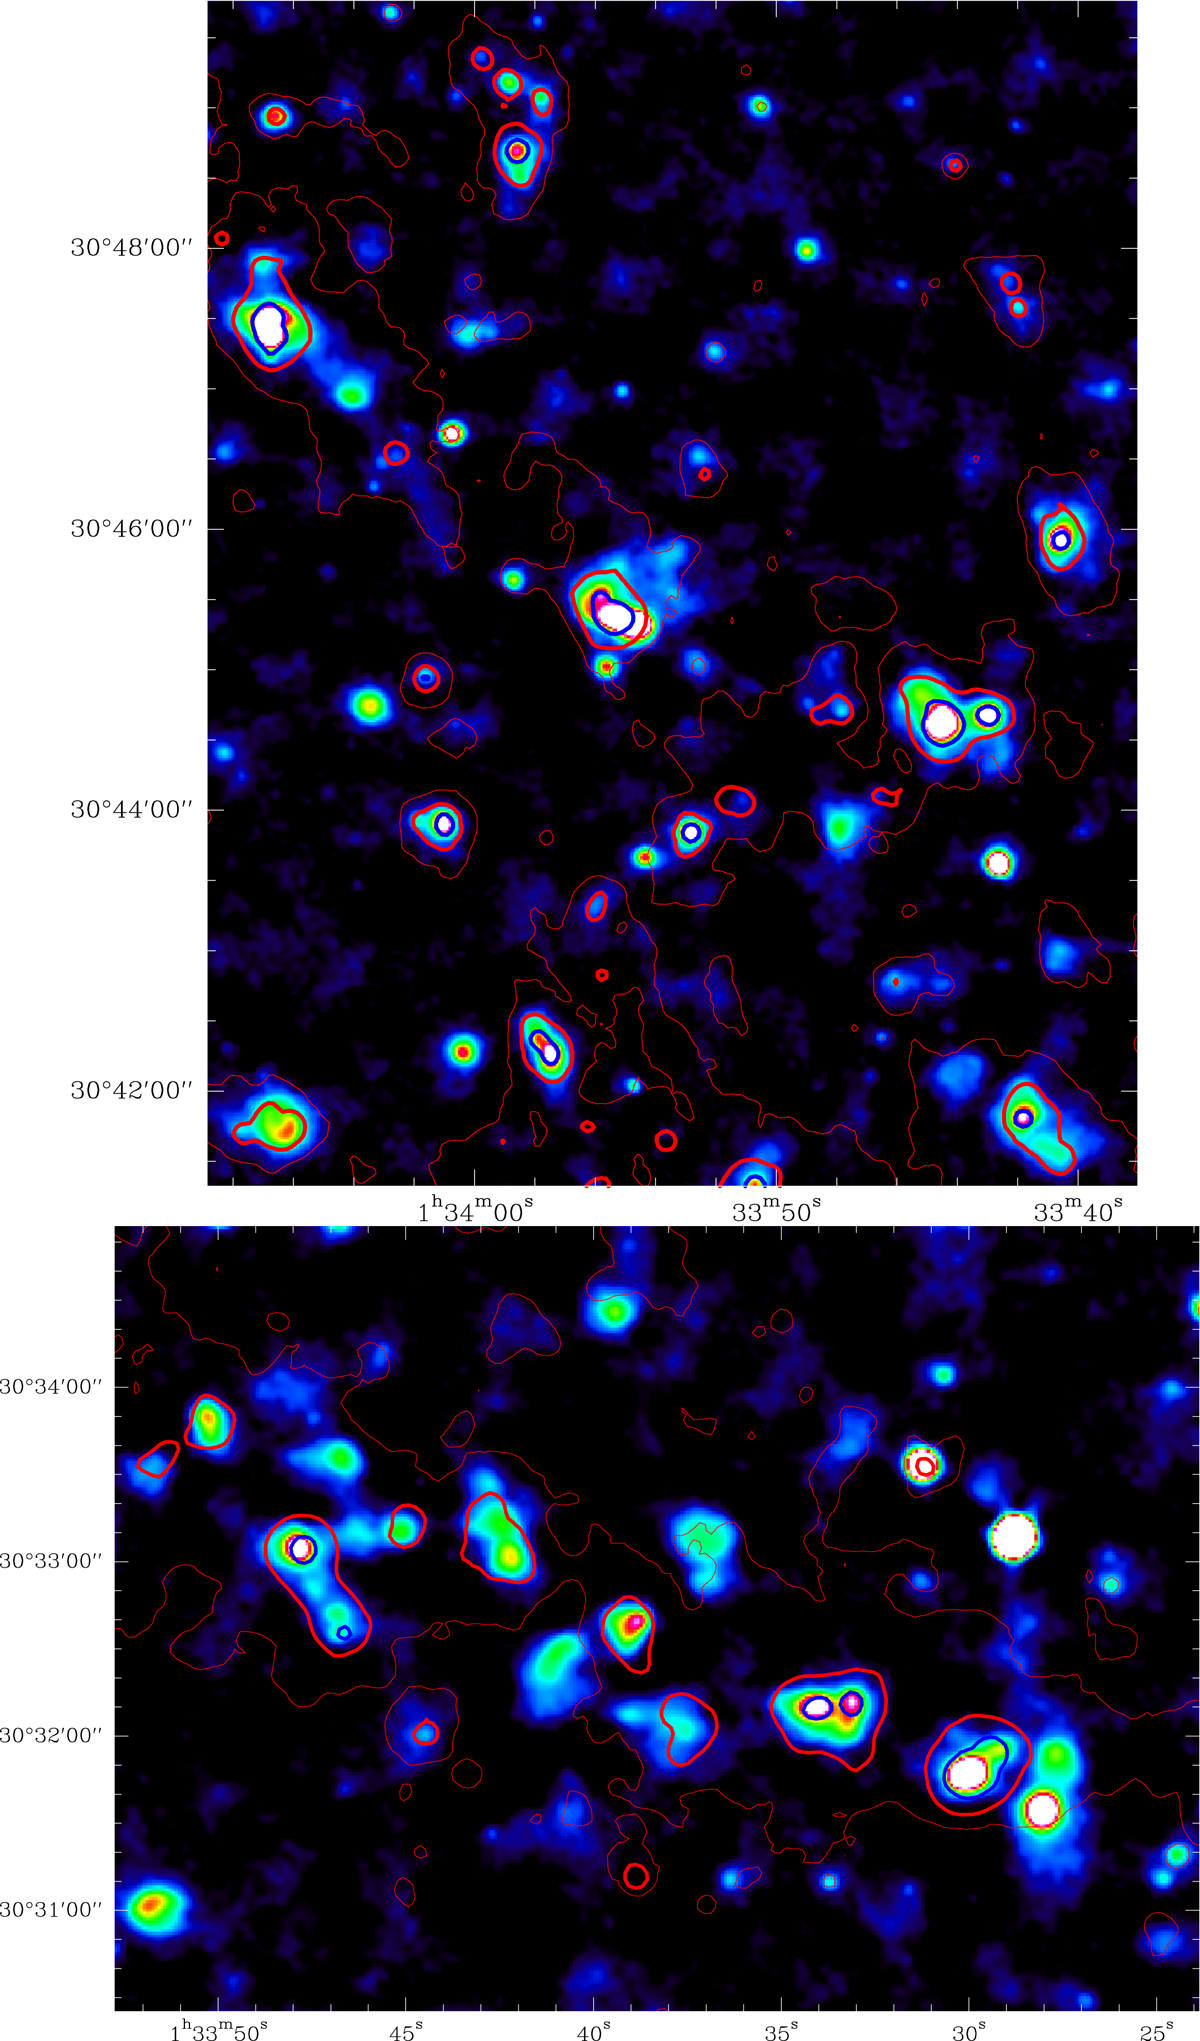
Radio and MIR emission of a kiloparsec-size region allowing details of tens of parsecs in size to be seen. Color image is 1.4 GHz radio emission from White et al. (2019) shown with a log scale of a portion of the northern (upper panel) and southern (bottom panel) side of M 33. Contours are 24 micron Spitzer emission at 1, 3, and 10 (thick blue line) MJy/sr.
Current usage metrics show cumulative count of Article Views (full-text article views including HTML views, PDF and ePub downloads, according to the available data) and Abstracts Views on Vision4Press platform.
Data correspond to usage on the plateform after 2015. The current usage metrics is available 48-96 hours after online publication and is updated daily on week days.
Initial download of the metrics may take a while.