Free Access
Fig. 6.
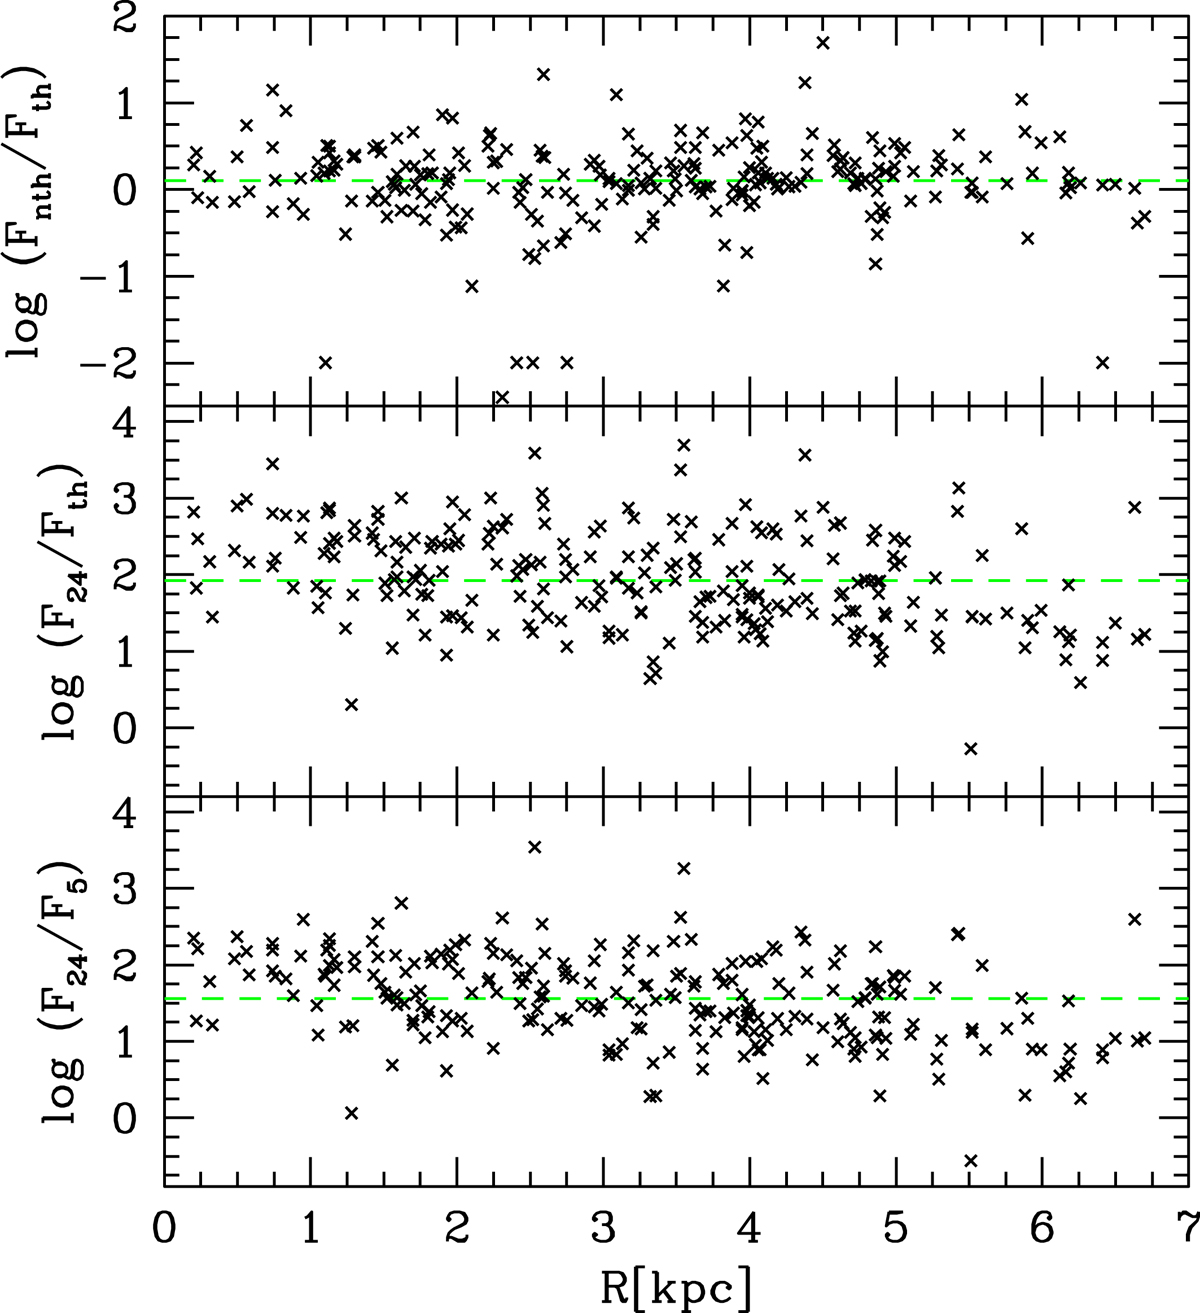
Radial trend of MIR-to-radio flux ratio at 5 GHz (bottom) for the thermal radio emission only (middle), and the nonthermal-to-thermal ratio at 5 GHz (top), plotted for exposed YSCs with radio counterparts in the catalog. Dashed green lines are reference lines placed at the median value of the distributions.
Current usage metrics show cumulative count of Article Views (full-text article views including HTML views, PDF and ePub downloads, according to the available data) and Abstracts Views on Vision4Press platform.
Data correspond to usage on the plateform after 2015. The current usage metrics is available 48-96 hours after online publication and is updated daily on week days.
Initial download of the metrics may take a while.