Fig. 5.
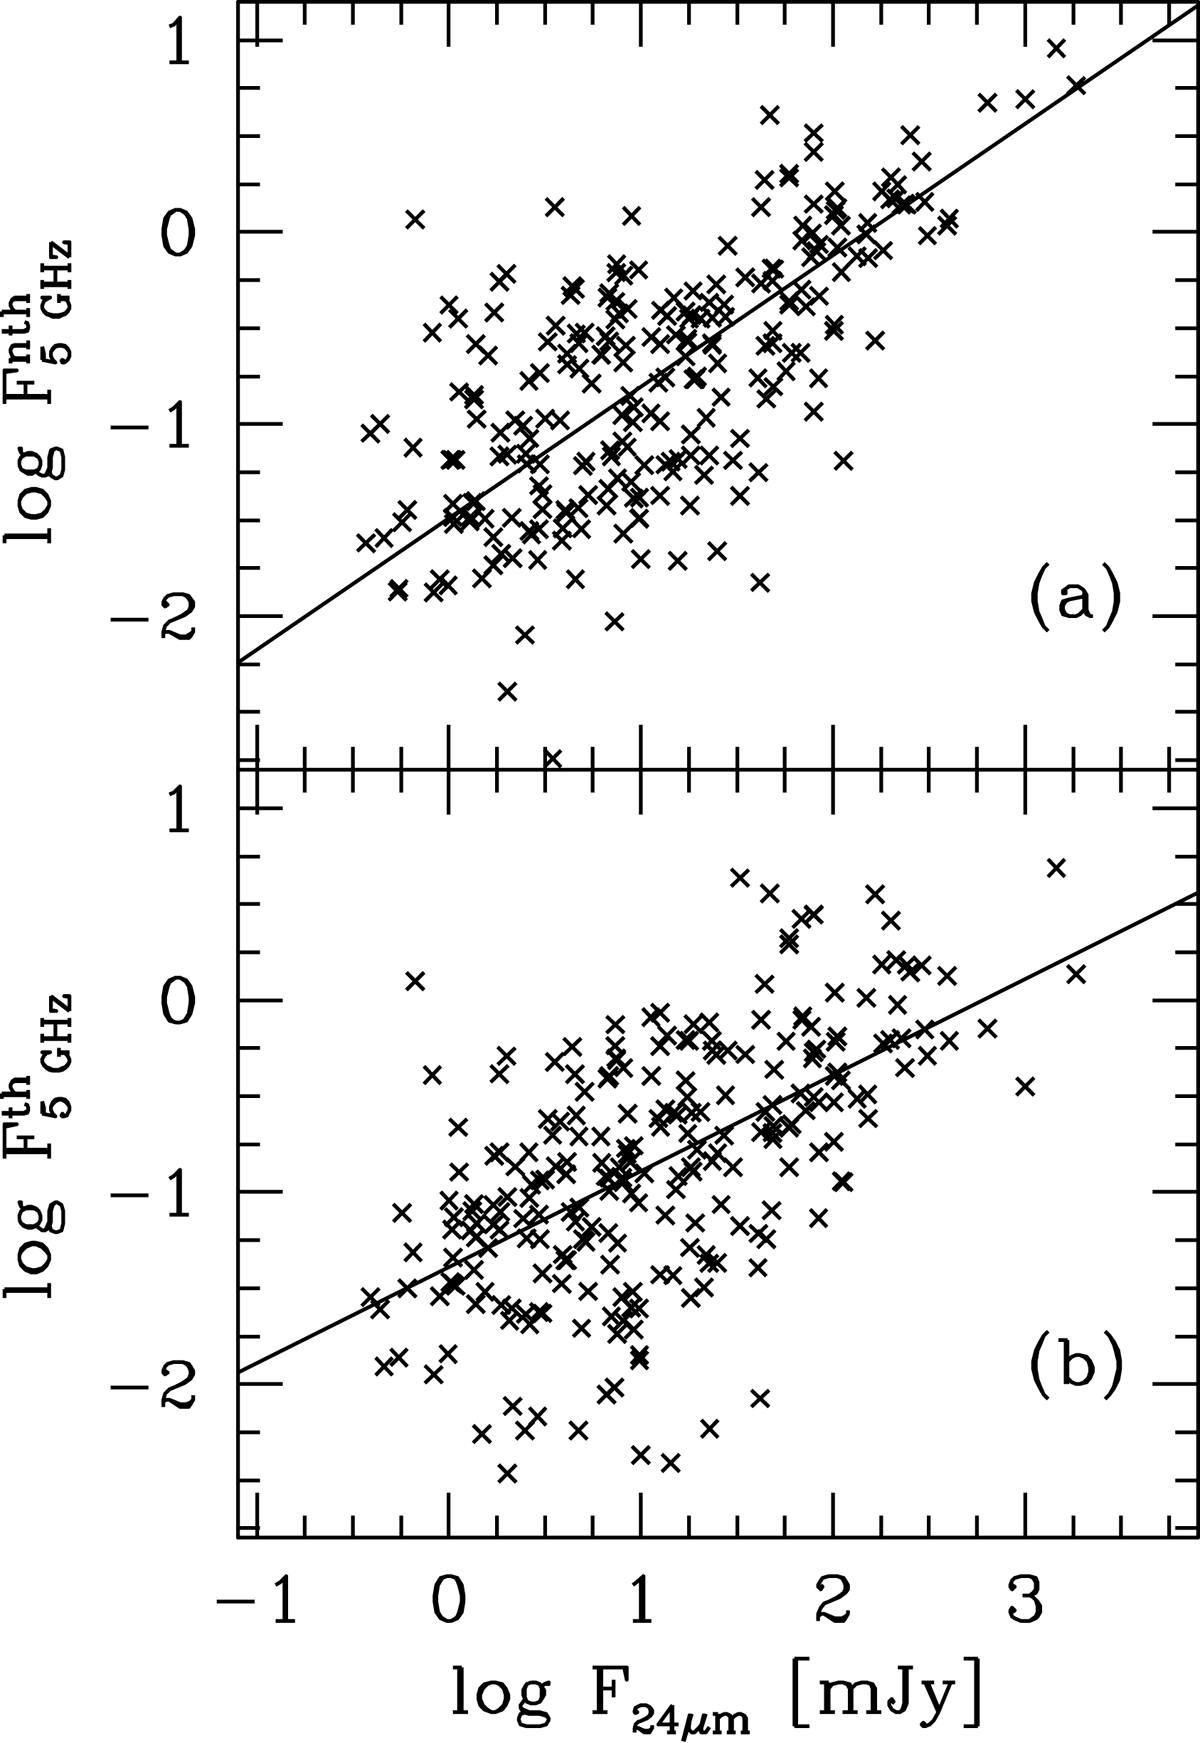
Correlations between the nonthermal (a) and thermal (b) radio continuum at 5 GHz with the 24 μm emission in 248 exposed HII regions of M 33. The lines are linear fits which minimize the distances of data points to straight lines and have slopes of 0.68 and 0.50 in panels a and b respectively. Radio flux units are mJy and have been measured using circular apertures with Rap = 1.5Rs.
Current usage metrics show cumulative count of Article Views (full-text article views including HTML views, PDF and ePub downloads, according to the available data) and Abstracts Views on Vision4Press platform.
Data correspond to usage on the plateform after 2015. The current usage metrics is available 48-96 hours after online publication and is updated daily on week days.
Initial download of the metrics may take a while.