Fig. 4.

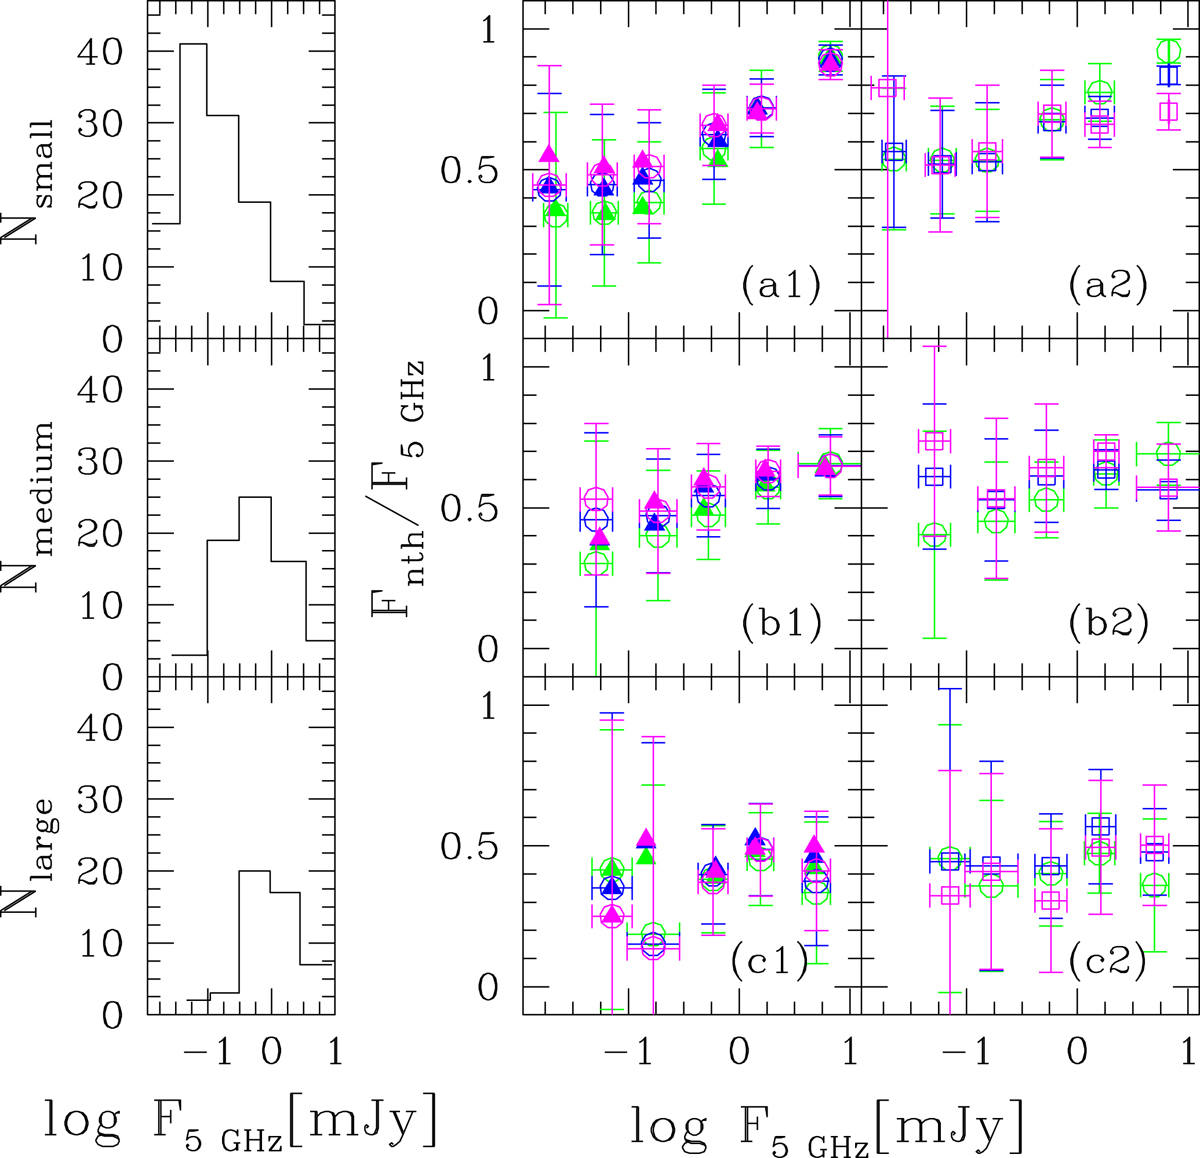
Nonthermal fraction at 5 GHz of radio sources associated with MIR sources in exposed HII regions shown in (a1) for small sources, in (b1) for medium sources, and in (c1) for large sources as a function of the radio flux density at the same frequency. Filled triangles are the median values and open circles are the mean values with the standard deviations. Colors indicate different apertures: green for Rap = Rs, blue for Rap = 1.5Rs and magenta for Rap = 2Rs. Left panels: number of sources in each bin for sources of small (top), medium (middle), and large (bottom) size. Right panels: nonthermal fractions for Rap = Rs (open green circles), in the annulus between Rs and 1.5Rs (open blue squares) and between 1.5Rs and 2Rs (open magenta squares) for small, medium, and large sources (a2, b2, c2 respectively). Radio flux units are mJy.
Current usage metrics show cumulative count of Article Views (full-text article views including HTML views, PDF and ePub downloads, according to the available data) and Abstracts Views on Vision4Press platform.
Data correspond to usage on the plateform after 2015. The current usage metrics is available 48-96 hours after online publication and is updated daily on week days.
Initial download of the metrics may take a while.


