Fig. 3.
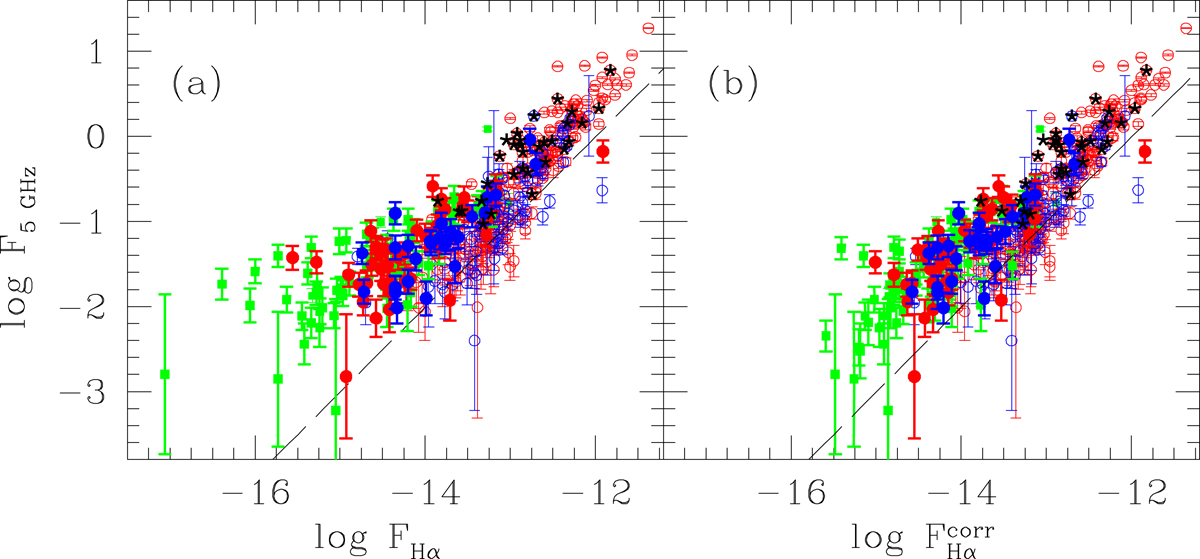
Hα fluxes in erg cm−2 s−1 measured through aperture photometry at the location of radio sources associated with MIR emission shown in panel a as a function of the radio flux recovered from catalogd data at 5 GHz in mJy. Color coding is the same as in Fig. 1 but open symbols have been used. Right panel b: display for the same sources the Hα flux corrected for internal extinction. Filled symbols indicates radio fluxes from aperture photometry at 6.3 GHz of b- and c-type MIR sources with no catalogd radio counterpart. The predicted Hα emission if the radio flux were due to free-free radiation only is shown with a dashed line. The star symbols indicate the presence of identified SNR in the regions (catalog code > 8).
Current usage metrics show cumulative count of Article Views (full-text article views including HTML views, PDF and ePub downloads, according to the available data) and Abstracts Views on Vision4Press platform.
Data correspond to usage on the plateform after 2015. The current usage metrics is available 48-96 hours after online publication and is updated daily on week days.
Initial download of the metrics may take a while.