Fig. 2.
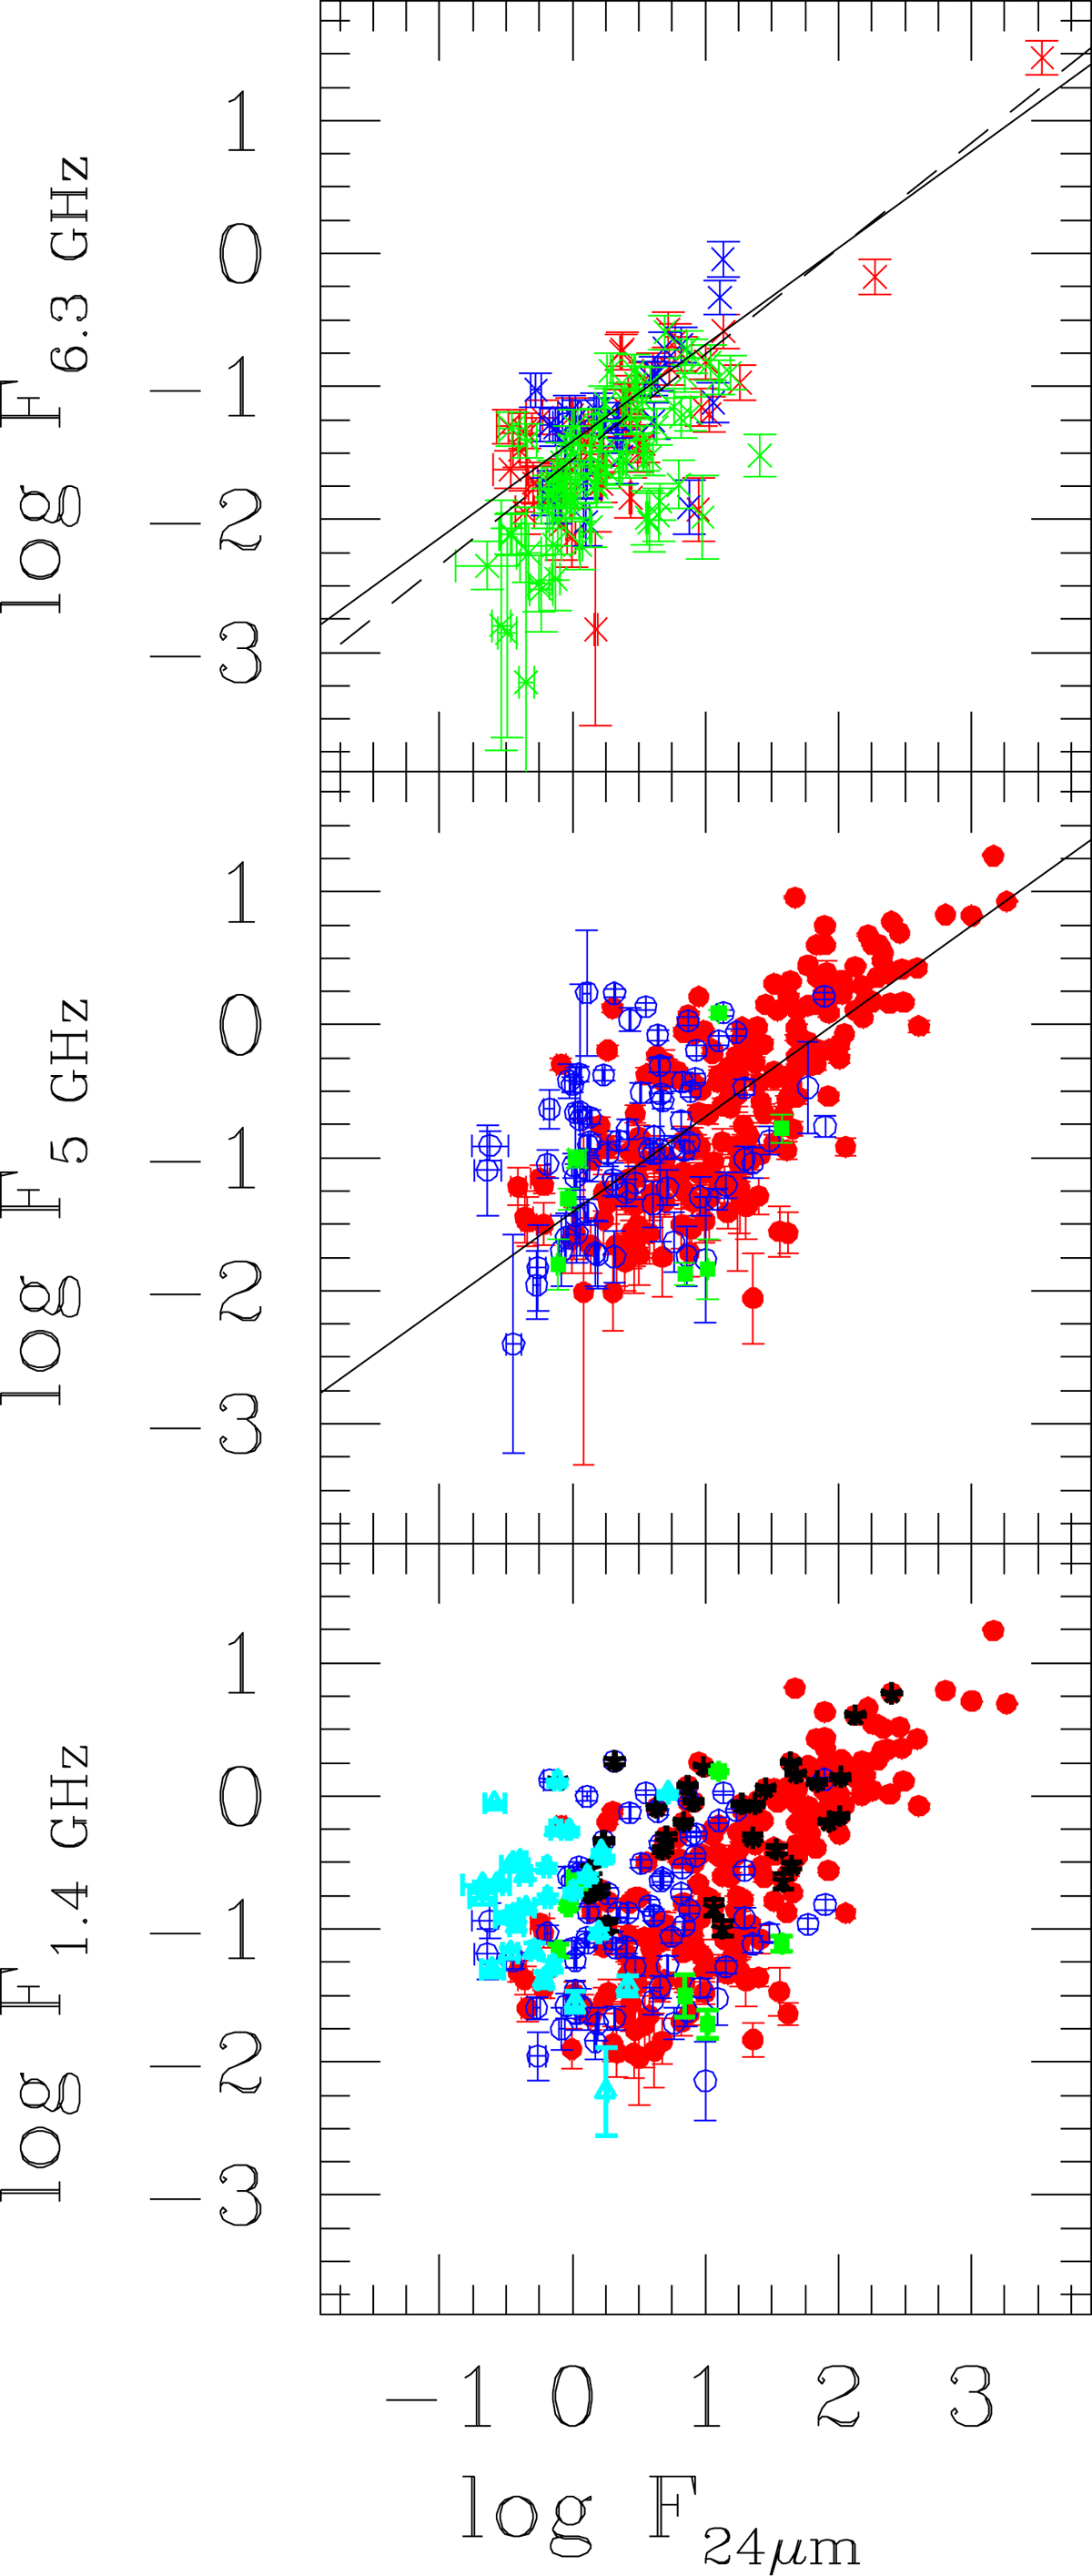
Bottom panel: radio flux at 1.4 GHz of sources in the White et al. (2019) catalog vs. the flux at 24 μm of the associated MIR sources, color coded as in Fig. 1. Flux units are mJy. The star symbols indicate the presence of identified SNRs in the region. Middle panel: radio flux at 5 GHz computed using the spectral index of each radio source in the catalog. We show only data for b-and c-type sources with the continuum line that is the best fit to them. Upper panel: radio flux at 6.3 GHz from aperture photometry of b- and c-type MIR sources with no cataloged radio counterpart but covered by the 6.3 GHz survey. Color coding is the same as in the other panels although cross symbols are used for these sources. The continuum line is the same as in the middle panel while the dashed line is the fit to all data in the middle and upper panels.
Current usage metrics show cumulative count of Article Views (full-text article views including HTML views, PDF and ePub downloads, according to the available data) and Abstracts Views on Vision4Press platform.
Data correspond to usage on the plateform after 2015. The current usage metrics is available 48-96 hours after online publication and is updated daily on week days.
Initial download of the metrics may take a while.