Fig. 10.
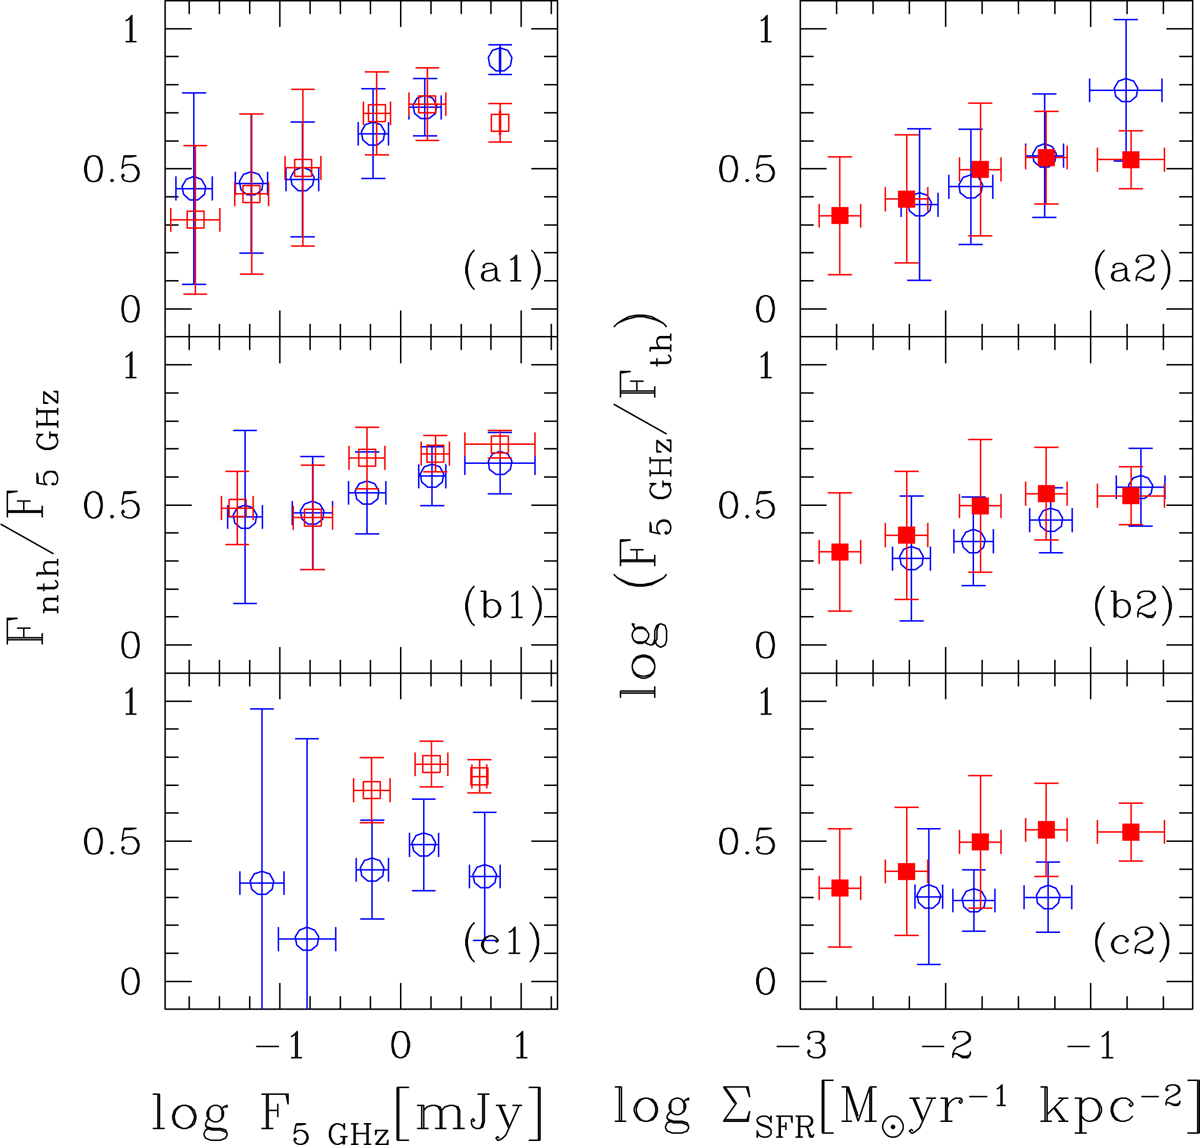
Left panels: nonthermal-to-total-radio-continuum flux density ratio at 5 GHz for radio sources associated to exposed YSCs (blue circles) using apertures with Rap = 1.5Rs for small (a1), medium (b1), and large (c1) sources. In the same panels we show the nonthermal-to-total-radio flux density ratio for the GMCs hosting the YSCs (red squares) as a function of the radio emission of the YSCs. We underline that not all YSCs considered here have an associated GMC. Right panels: total-to-thermal radio flux ratio for the whole ensemble of GMCs hosting exposed YSCs (filled symbols), binned according to their star formation rate per unit area. Radio continuum has been used to estimate the SFR density (red squares). From top to bottom we compare the ratios relative to GMCs with the ratios relative to small, medium, and large sources respectively (open blue circles) binned according to the SFR per unit area. The area around the source is circular with a radius of 1.5Rs.
Current usage metrics show cumulative count of Article Views (full-text article views including HTML views, PDF and ePub downloads, according to the available data) and Abstracts Views on Vision4Press platform.
Data correspond to usage on the plateform after 2015. The current usage metrics is available 48-96 hours after online publication and is updated daily on week days.
Initial download of the metrics may take a while.