Free Access
Fig. 9
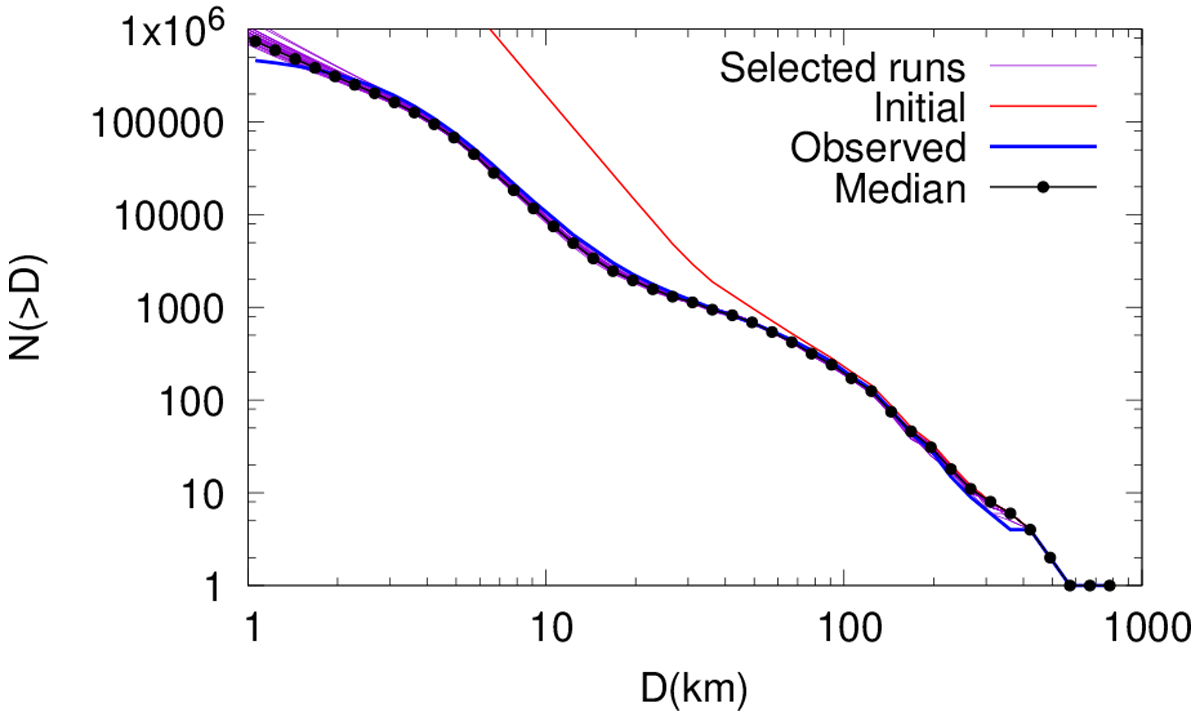
Size–frequency distributions of the global MB, calculated as the sum of the SFDs of the individual regions. The selected runs and their median are plotted in purple and black lines, respectively. The observed SFD is plotted in blue and the initial SFD is illustrated in red.
Current usage metrics show cumulative count of Article Views (full-text article views including HTML views, PDF and ePub downloads, according to the available data) and Abstracts Views on Vision4Press platform.
Data correspond to usage on the plateform after 2015. The current usage metrics is available 48-96 hours after online publication and is updated daily on week days.
Initial download of the metrics may take a while.