Fig. 11
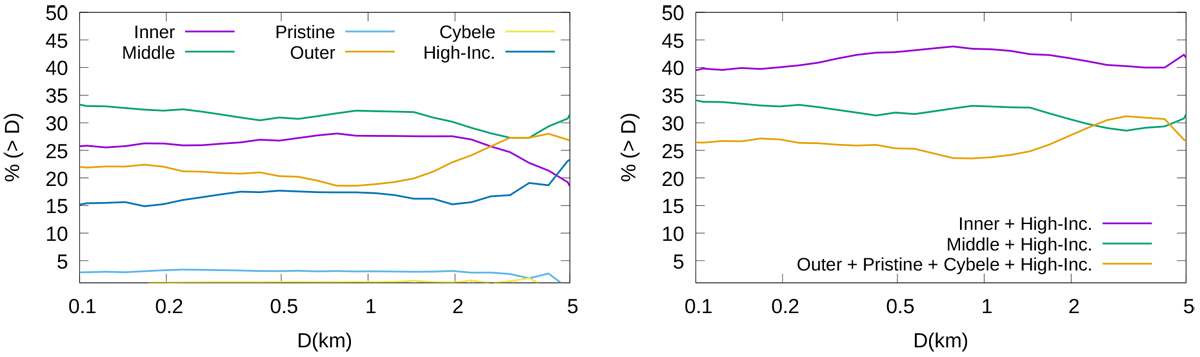
Percentage of NEAs coming from the different regions of the MB with respect to the total cumulative number of NEAs we obtained in the simulations. Left panel: considering the six regions. Right panel: distributing the High-Inclination NEAs among the Inner- Middle-, and Outer-belt NEAs, and adding the Pristine and Cybele contributions to the Outer-belt NEAs.
Current usage metrics show cumulative count of Article Views (full-text article views including HTML views, PDF and ePub downloads, according to the available data) and Abstracts Views on Vision4Press platform.
Data correspond to usage on the plateform after 2015. The current usage metrics is available 48-96 hours after online publication and is updated daily on week days.
Initial download of the metrics may take a while.