Fig. 4.
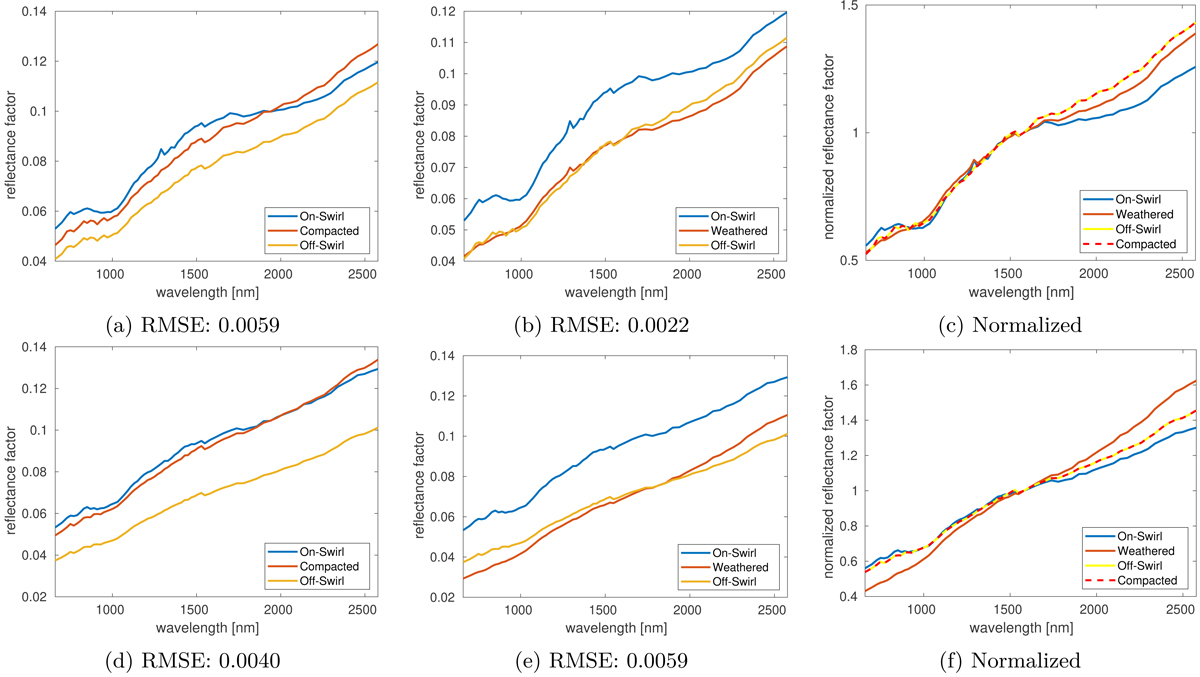
Illustration of the different spectral trends for two on-swirl and off-swirl pairs of spectra from Reiner Gamma. Panels a–c: pair of spectra with a low CSSI, where the space-weathering model provides a better fit. Panels d–e: pair of spectra with a high CSSI, where the soil compaction model provides a better fit. The best-fit spectra for a compacted off-swirl spectrum are shown in panels a and d. On-swirl spectra that have been artificially space-weathered according to Wohlfarth et al. (2019) to obtain a best fit to the measured off-swirl spectrum are shown in panels b and e. The locations of the spectra are displayed in Fig. 1a. The exact locations, best-fit model parameter values and CSSI values are listed in Table 3. The best-fit root mean squared errors (RMSE) are listed in the captions of the individual diagrams.
Current usage metrics show cumulative count of Article Views (full-text article views including HTML views, PDF and ePub downloads, according to the available data) and Abstracts Views on Vision4Press platform.
Data correspond to usage on the plateform after 2015. The current usage metrics is available 48-96 hours after online publication and is updated daily on week days.
Initial download of the metrics may take a while.